
Fig 2.
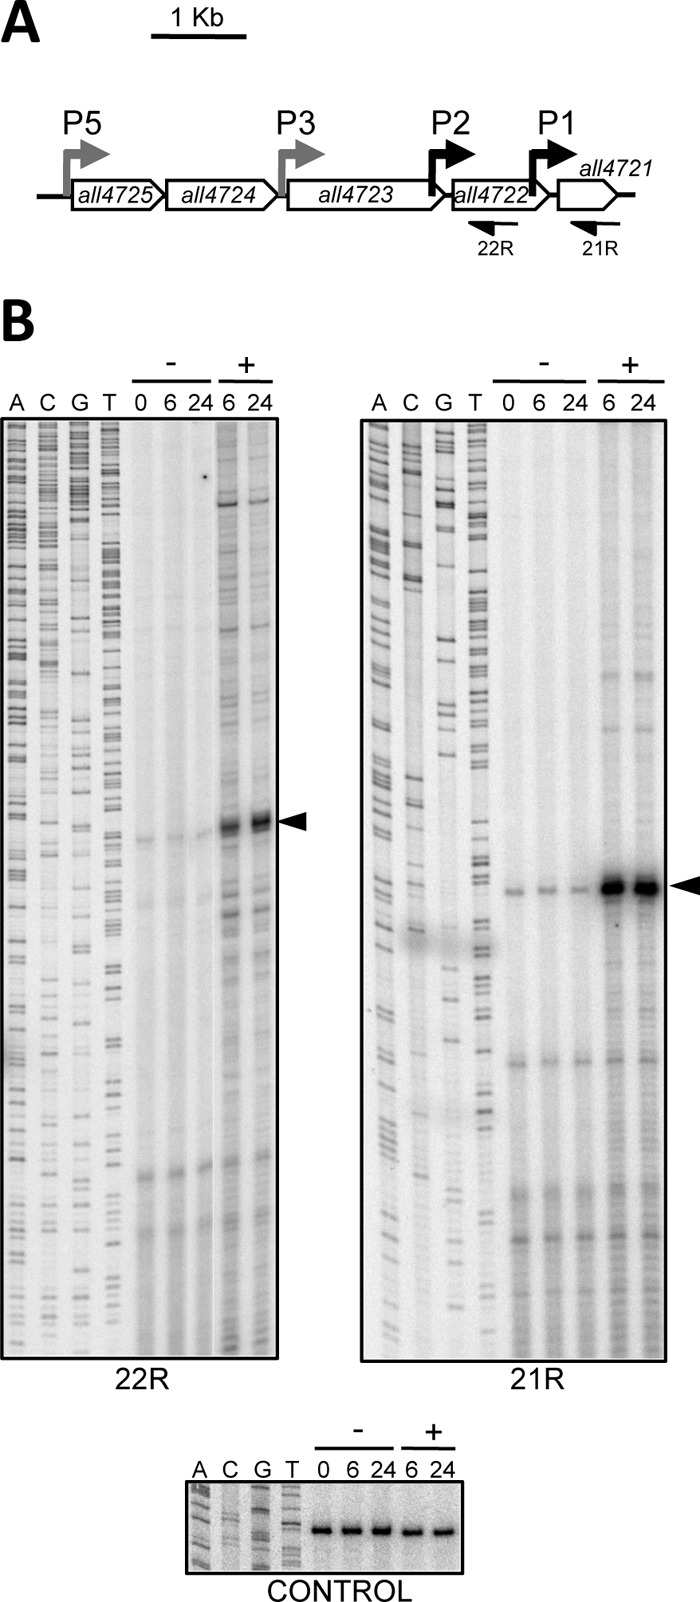
P2 and P1 are induced by metal deficiency. (A) Schematic representation of the all4725-all4721 operon. The localization of the promoters is indicated by bent arrows, with those that were analyzed by primer extension in panel B shown in black. Primers used for primer extension in panel B are also depicted. (B) RNA from cells not treated (−) or treated (+) with 20 μM TPEN for the period of time indicated at the top (in hours) was subjected to primer extension analysis with primer 22R (left) or 21R (right). A sequencing reaction generated with the same oligonucleotide used for primer extension is shown at the left of each panel for sizing. Arrowheads point to extension products at the expected positions of transcripts initiating at P2 (left) and P1 (right). The bottom panel corresponds to a primer extension control experiment performed with the same RNA preparations and primer ALL4727_2R.