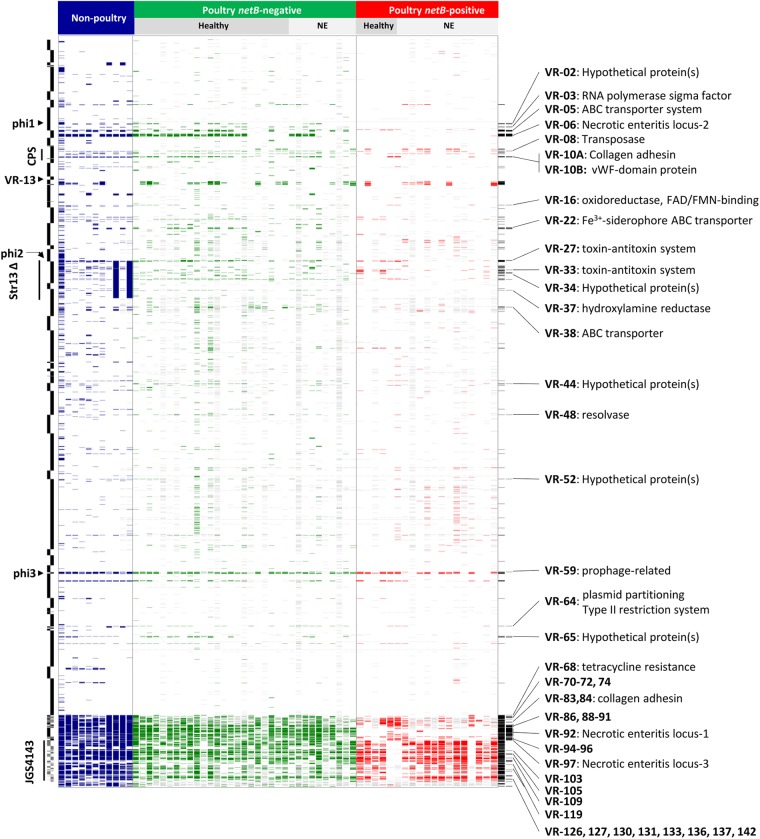
Fig 1.
Comparative genomic hybridization results of C. perfringens isolates from healthy and diseased chickens. Each column represents a different strain, and each row represents a different microarray probe. Gene probes called absent are colored blue, green, or red, and undetectable probes are colored gray. The colors indicate nonpoultry strains (blue), netB-negative isolates (green), and netB-positive isolates (red). Nonpoultry strains (from left to right) are SM101, NCTC 8239, F4969, ATCC 3626, JGS1495, JGS1721, JGS1987, ATCC 13124 (in silico), Str13 (in silico), ATCC 13124 (hybridization), and Str13 (hybridization). The host disease statuses of the isolate sources are given at the top. Probes are ordered according to the draft CP4 genome sequence, with the start of the genome at the top, and the CP4 contig boundaries are indicated on the left side. Probes specific for JGS4143 are placed at the bottom. On the left side, two regions identified as variable by Myers et al. (25), the capsular polysaccharide locus (CPS) and the large deletion found in Str13 (Str13Δ), are labeled, as are the locations of prophage. Variable probes and those significantly associated with netB-positive isolates (Pcorr < 0.05, Fisher's exact test) are indicated in the final two columns (black) on the right. The latter probes are annotated with the variable region and its putative function, where known (see Table S3 in the supplemental material for details on the variable regions). vWF, von Willebrand factor; FAD, flavin adenine dinucleotide; FMN, flavin mononucleotide.

