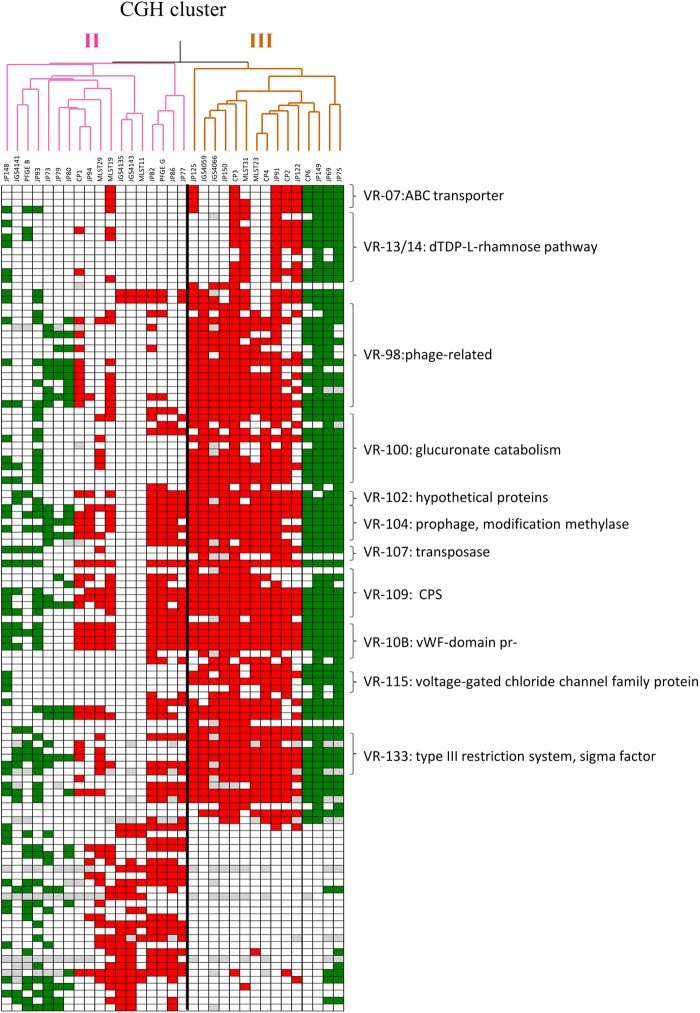
Fig 8.
Heat map of C. perfringens poultry isolates found in CGH clusters II and III showing genes significantly associated with each cluster. Each column represents a different strain, and each row represents a different microarray probe. Gene probes called absent are colored green or red, and undetectable probes are colored gray. The colors for absent genes indicate netB-negative isolates (green) and netB-positive isolates (red). Only the 33 poultry isolates that assembled into groups II and III based on hierarchical clustering of microarray CGH data are shown. See Table S3 in the supplemental material for details on the variable regions.

