
Fig 2.
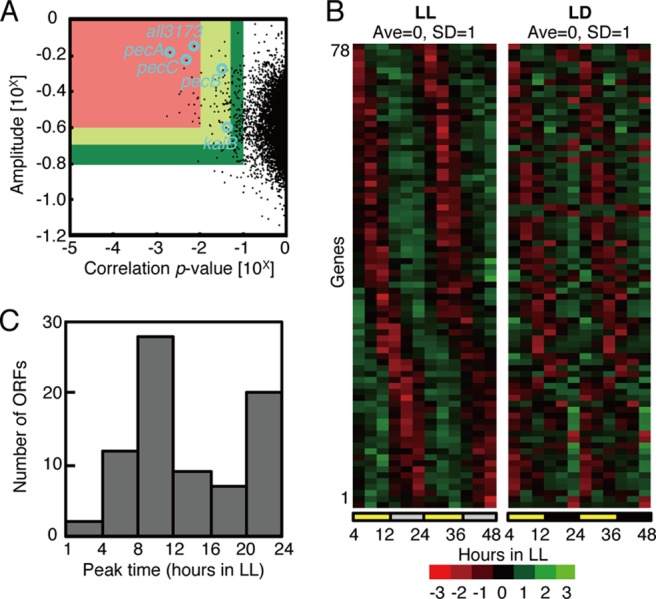
Genome-wide circadian transcription profiles under LL conditions. (A) Variations in the oscillatory indices, amplitude (defined as standard deviation [SD] normalized to the mean value; ordinate), and a cosine-fitting correlation score (correlation P value; abscissa) for each transcript under LL conditions. Each index is defined in the Materials and Methods. Briefly, a higher amplitude represents larger fluctuations, and a lower P value means a better correlation to a periodic (sinusoidal) waveform with a 24-h period. Seventy-eight “cycling genes” were extracted, with P values of <0.05 and amplitudes of >10−0.7 (within the red and yellow regions). For more stringent filtration, the lower amplitude and the higher P value from two independent experiments were used to ensure reproducibility. The circles indicate the all3173 and pecBAC (alr0523 to -0525) genes used for the bioluminescence reporter analysis and the kaiB gene. (B) Expression profiles of the 78 cycling genes sorted by peak time under LL conditions (left). The panel on the right shows a double plot of the expression profiles of the corresponding genes in one LD cycle reconstructed by connecting data from hour 4 to 12 in LL and hour 4 to 12 in the dark. The colors in descending order from red to black to green represent normalized data. The average and SD over two cycles are 0.0 and 1.0, respectively. The average levels in two independent experiments were used for the analysis. (C) Phase distributions of the peak expression times of 78 circadianly expressed genes. The numbers of ORFs from two independent experiments are plotted on the ordinate.