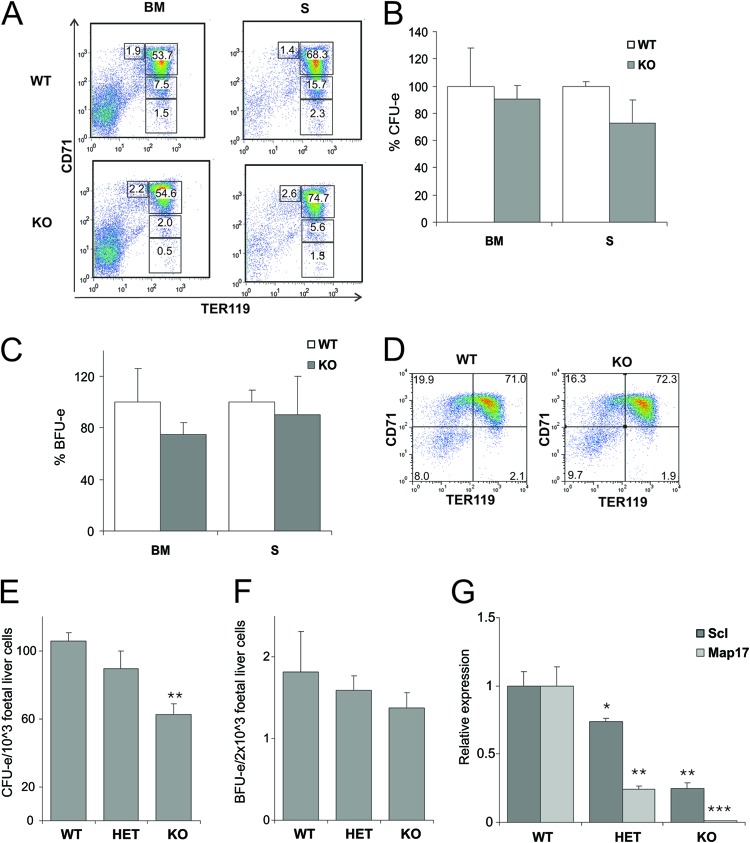
Fig 4.
Response to stress hematopoiesis is normal, but CFU-e numbers are reduced in fetal liver of SclΔ40/Δ40 mice. (A) Dot plots showing representative staining of erythroid cells in bone marrow (BM) and spleen (S) 5 days after induction of stress hematopoiesis by PHZ. Values indicate averages for 4 animals. (B and C) CFU-e (B) numbers are reduced, but BFU-e (C) numbers are unaltered in SclΔ40/Δ40 mice. Results are shown as percentages of colonies compared to SclWT/WT mice. (D) Dot plots showing representative CD71/TER119 profile of E12.5 fetal liver cells. (E and F) CFU-e (E) and BFU-e (F) counts in E12.5 fetal livers. **, P ≤ 0.005. (G) Expression analysis of Scl and Map17 in E12.5 fetal livers. *, P ≤ 0.05; **, P ≤ 0.01; ***, P ≤ 0.001. WT, SclWT/WT; HET, SclWT/Δ40; KO, SclΔ40/Δ40.

