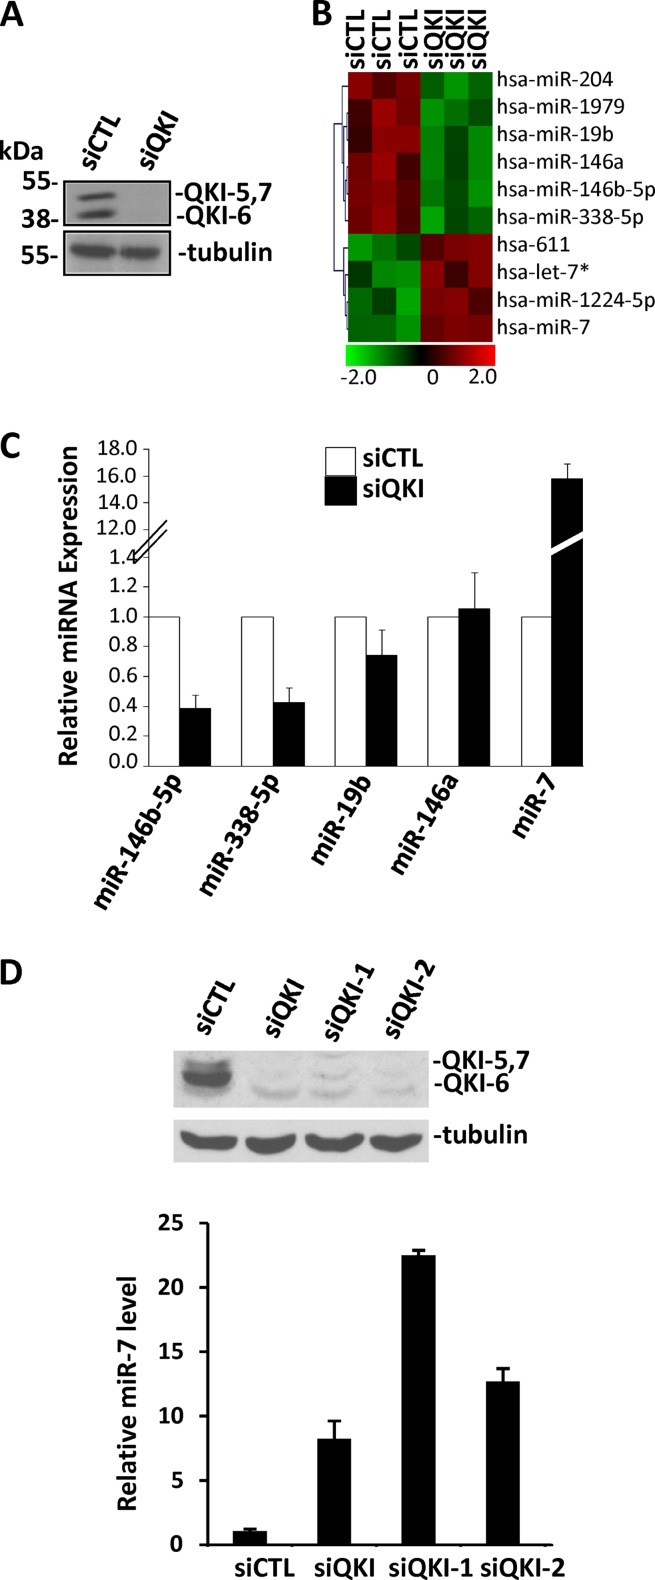
Fig 1.
Identification of QKI regulated miRNAs in U343 glioblastoma cells. (A) Cell extracts prepared from U343 cells transfected with siCTL or siQKI were separated by SDS-PAGE and immunoblotted with anti-pan-QKI antibodies and β-tubulin as a loading control. (B) Total RNA purified from siCTL- and siQKI-transduced U343 cells was analyzed for miRNA expression using miRNA microarray analysis by LC Sciences. The heat map indicates the differential expression of miRNAs in the siCTL- versus siQKI-transduced cells. Each row represents a different mature miRNA sequence. Shown are median values from normalized, log ratio (base 2) data sets and plotted as a heat map from three biological and technical replicates. Green indicates decreasing miRNA expression, whereas red indicates increasing miRNA expression. (C) TaqMan qRT-PCR was performed to verify the changes observed in the microarray. miRNAs with signals of >500 and a log2 change (siQKI/siLuc) of <−1 or >1 were verified. The data shown represent the mean expression level of 3 different biological replicates calculated by ΔCT normalized to the endogenous GAPDH control of 3 independent experiments performed in triplicate. Error bars represent standard deviations of the means. (D) U343 cells were transfected with the indicated control or QKI siRNAs and the levels of miR-7 monitored by TaqMan qRT-PCR.

