Fig 3.
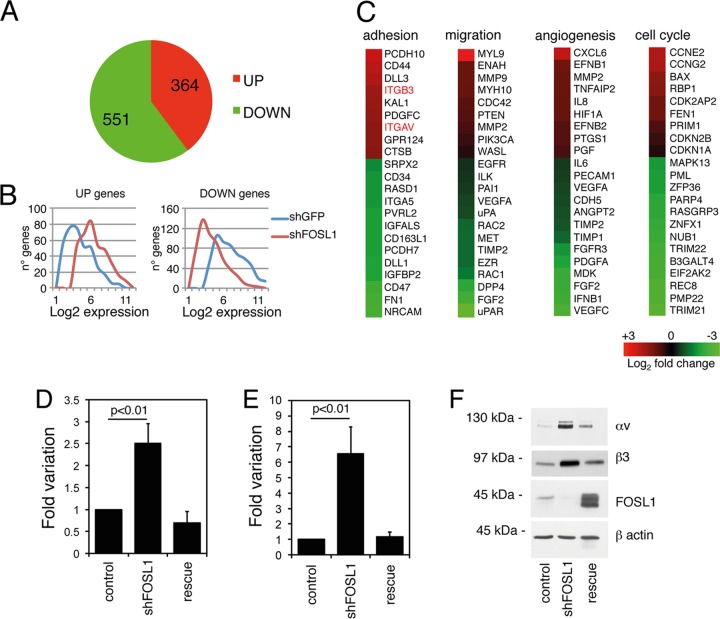
FOSL1 is a negative regulator of the expression of integrin αv and β3. (A) Pie chart of microarray analysis showing genes differentially expressed following FOSL1 silencing in HUVEC. (B) Average levels of expression of genes upregulated and downregulated by FOSL1 silencing in HUVEC. (C) Heat map of microarray analysis showing genes up- and downregulated following FOSL1 silencing in HUVEC. Integrin αv and β3 genes are identified in red. (D and E) Expression levels of integrin αv and β3 mRNAs, respectively, were analyzed by RT-qPCR. Results were normalized to glyceraldehyde-3-phosphate dehydrogenase mRNA. Mean values from three independent experiments are shown with standard deviations. (F) Western blot analysis of the expression of integrins αv and β3 and FOSL1 in cells silenced for FOSL1 and in FOSL1-silenced HUVEC infected with a viral vector expressing an shRNA-resistant FOSL1 mutant (rescue). β-Actin was used to verify equal loading.

