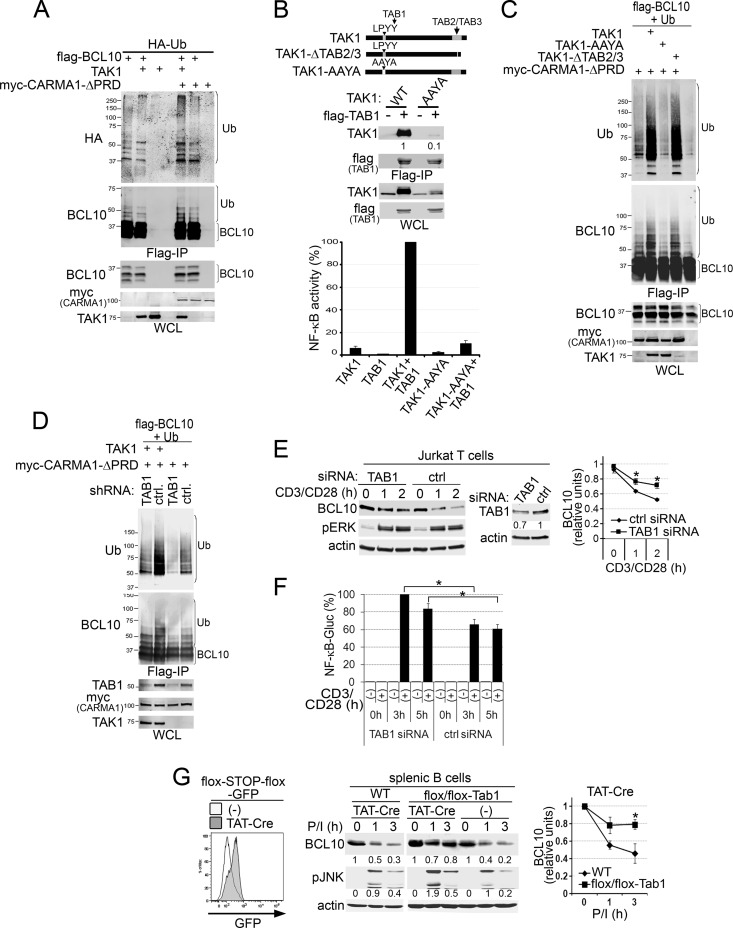
Fig 3.
TAK1 interaction with TAB1 controls CARMA1-dependent ubiquitination and degradation of BCL10. (A to D) 293T cells were cotransfected for 48 h with combinations of expression vectors for the proteins indicated at the top of each blot. WCLs were prepared for Flag IPs and Western blots as described in Materials and Methods. BCL10 polyUb (A, C, and D) or TAK1-TAB1 interaction (B, middle) in Flag IPs (A to D, top panels) or WCLs (A to D, bottom panels) was detected using the indicated antibodies (left of the blots). (B) The top diagram shows TAK1 mutations that disrupt interaction with TAB2/3 (TAK1-ΔTAB2/3) or TAB1 (TAK1-AAYA). Middle, TAK1 blots with levels of TAK1 in the Flag IPs are normalized to those in WCLs (to compensate for TAK1-WT protein stabilization induced by TAB1 (50, 51). Bottom, NF-κB activity in 293T cells cotransfected with Igκ2-IFN-luciferase (NF-κB reporter), pRL-TK (transfection control), and combinations of the indicated plasmids. The graph shows means ± SEM from four independent experiments normalized as the percentage of the highest value in each experiment. (C) Immunoblot analysis of BCL10 polyUb by the CARMA1 and TAK1 mutants described for panel B. (D) Transfections were performed in cells transduced with LVs expressing control or TAB1-specific shRNAs. (E) Jurkat T cells were transfected with control or TAB1 siRNAs, stimulated with anti-CD3/CD28, lysed, and blotted with the antibodies indicated on the left. (F) Jurkat T cells, transduced to express a secreted NF-κB-controlled GLuc, were transfected with control or TAB1 siRNAs and stimulated with anti-CD3/CD28 for 0 to 5 h. GLuc activity was analyzed as described in Materials and Methods, normalized to that of unstimulated cells, and plotted as the percentage of the highest GLuc value in each experiment. (G) Splenic B cells purified from flox/flox-TAB1, WT, and flox/flox-GFP reporter mice were treated with TAT-Cre and stimulated as described in Materials and Methods. Left, GFP induction in untreated (−) or TAT-Cre-treated flox/flox-GFP reporter B cells. Middle, cells were lysed and blotted with the antibodies indicated on the left. The signal intensities of BCL10 and pJNK levels relative to that of actin are displayed below the immunoblots and graphically for BCL10 (right). (E and G) The graphs show the means ± SEM from three independent experiments. BCL10 levels were normalized relative to that of actin. *, P > 0.05, unpaired Student's t test.

