Fig 5.
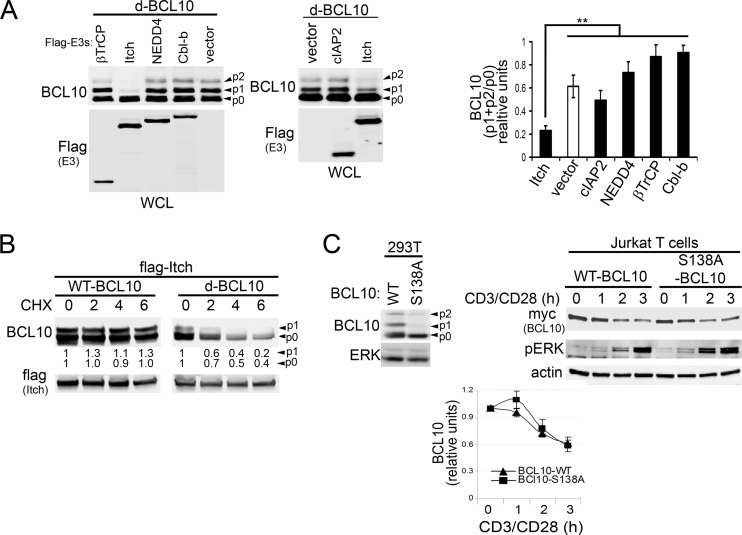
ITCH overexpression promotes BCL10 turnover. (A and B) 293T cells were cotransfected with candidate Flag-tagged E3s and a modified 6×myc-BCL10 construct (A and B) (d-BCL10; see Materials and Methods for details) or WT-BCL10 (B). WCLs were prepared and blotted for BCL10 and E3 expression (anti-Flag) (left of blots). Unphosphorylated (p0) and phosphorylated BCL10 bands (p1 and p2) are indicated by arrowheads. (A) Right, densitometry of phosphorylated (p1 + p2) relative to unphosphorylated (p0) BCL10 levels. **, P > 0.01, unpaired Student's t test comparing p-BCL10 levels in ITCH-expressing cells to those in vector-, cIAP2-, NEDD4-, Cbl-b-, and βTrCP-expressing cells. (B) Cells were incubated with CHX for 0 to 6 h and analyzed for BCL10 and Flag-ITCH expression. Quantification of p0 or p1 levels were normalized relative to that of Flag (shown below the BCL10 blots, zero time point = 1). (C) Left, levels of BCL10 and ERK in 293T cells transfected with myc-tagged WT or serine 138 to alanine (S138A)-mutated BCL10. Right, Jurkat T cells stably expressing myc-BCL10 or myc-BCL10-S138A were stimulated with CD3/CD28 for 0 to 3 h and analyzed for the indicated proteins (left of blots). Bottom, BCL10 levels relative to that of actin (means ± SEM from three independent experiments, zero time point = 1).

