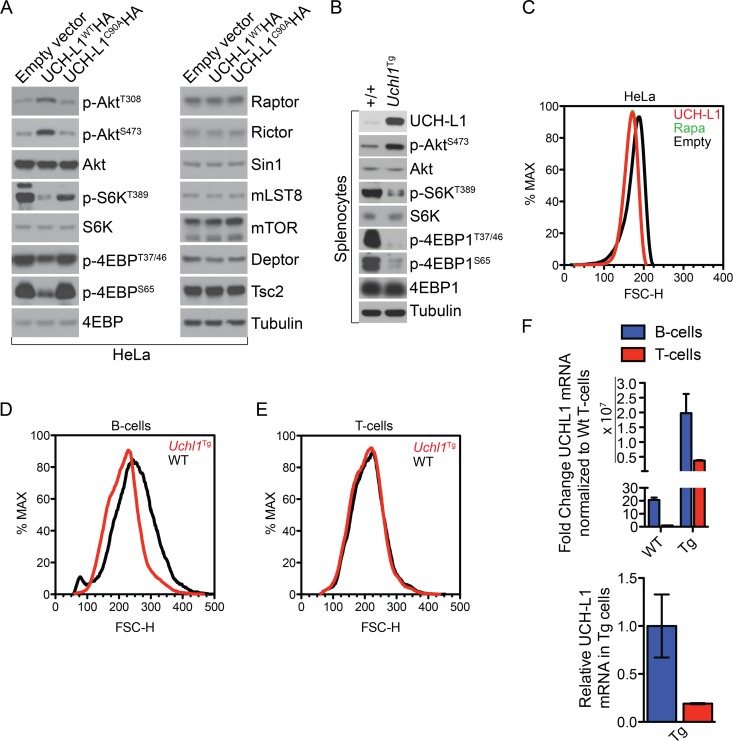
Fig 1.
UCH-L1 expression leads to reduced mTORC1 activity. (A) HeLa cells were stably transduced with either control (empty vector) or wild-type UCH-L1 (UCH-L1WTHA)- or catalytically inactive UCH-L1 (UCH-L1C90AHA)-encoding lentivirus, followed by immunoblot analysis of mTORC1 and mTORC2 substrates and binding proteins as indicated. (B) Spleens were harvested from age-matched mice of the indicated genotypes and immunoblotted for the indicated mTORC1 and mTORC2 substrates. (C) HeLa cells stably transduced or not with UCH-L1 were followed by flow cytometry to monitor cell size. For comparison, control HeLa cells were treated with rapamycin (100 nM) for 48 h. The green rapamycin tracing is largely hidden by that of UCH-L1. (D and E) B and T lymphocytes were isolated from the spleens of age-matched mice of the indicated genotypes by magnetic isolation. Cell size (FSC-H) was determined by flow cytometry. The graphs are representative of those seen in three independent experiments. (F) Relative expression of UCH-L1 in B or T cells from Uchl1Tg or wild-type mice was determined by quantitative real-time PCR using TaqMan gene expression assays. The graphs represent the means and standard errors for three different mice.

