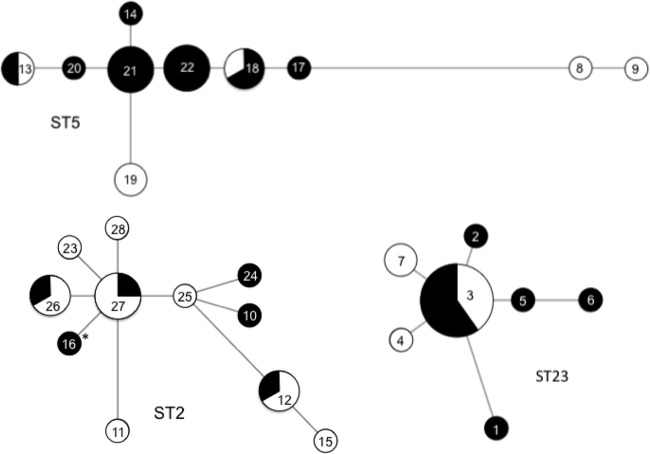
Fig 3.
Minimum spanning tree analysis of ST2, ST5, and ST23 strains typed by MLVA. Each circle denotes a particular MLVA profile, and the size of the circle indicates the number of GRSE (black) and GSSE (white) strains displaying that particular profile. The lines denote connections between MLVA profiles. The asterisk indicates the GRSE strain resistant to vancomycin (MIC value = 8 mg/liter).

