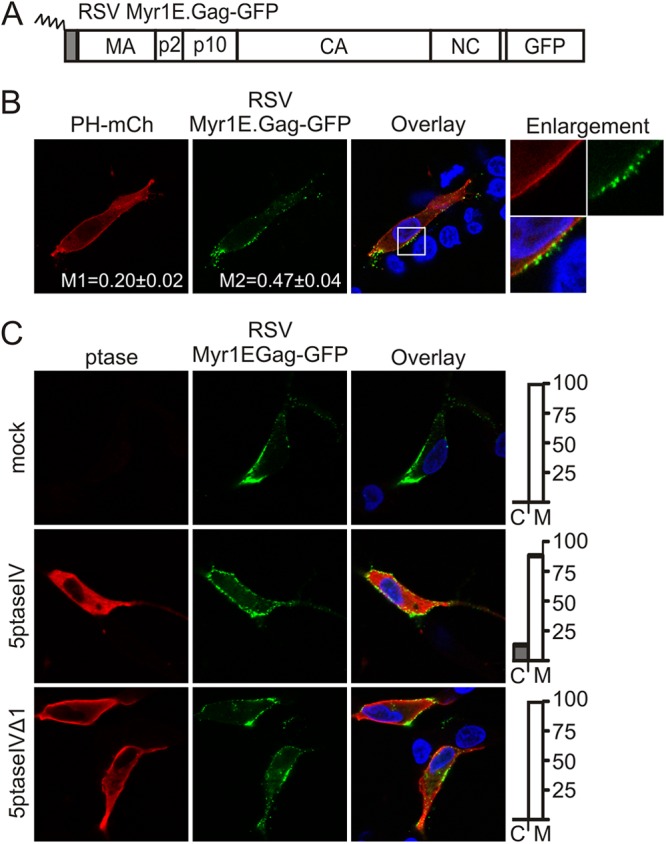
Fig 4.

Effect of 5ptaseIV expression on RSV Gag.Myr1E-GFP localization. (A) Schematic representation of RSV Gag.Myr1E-GFP showing the 10-amino-acid membrane-binding domain of the v-Src protein as a gray box and myristylation as a zigzag line. (B) QT6 cells were transfected with pGag.Myr1E-GFP and pPH-mCherry. Mander's colocalization analysis was conducted as described in Fig. 1B. (C) QT6 cells were transfected with pGag.Myr1E-GFP alone (top row) or cotransfected with pMyc-5ptaseIV (middle row) or pMyc-5ptaseIVΔ (bottom row). Graphs on the right show the percentage of cells with Gag in the cytoplasm (C) or at the plasma membrane (M). Statistically significant differences in Gag localization were determined as described in Fig. 2A.
