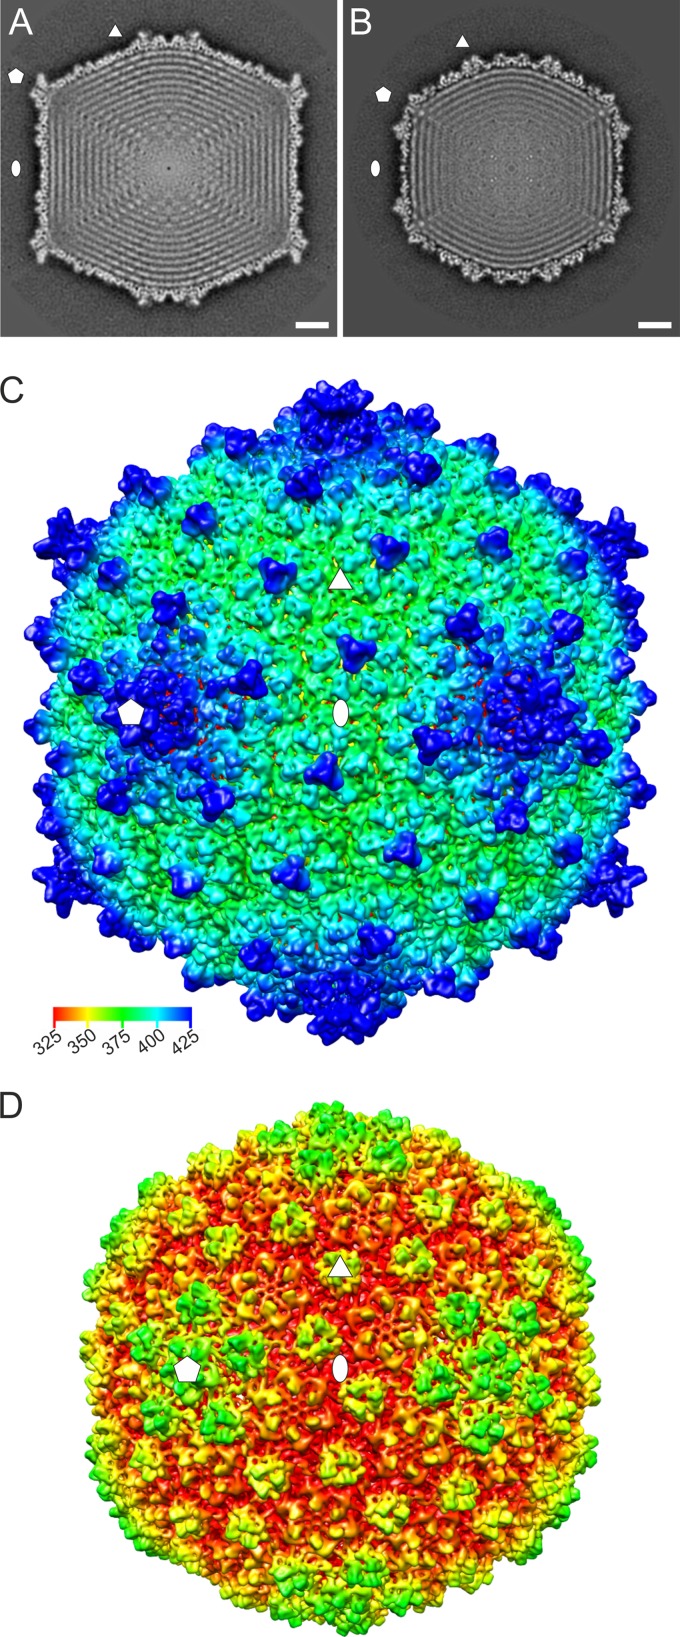
Fig 6.
Cryo-EM reconstruction of the HVTV-1 and HSTV-2 capsids. (A and B) Central section of HVTV-1 (A) and HSTV-2 (B) capsids. The icosahedral reconstructions are viewed along a 2-fold axis. The ellipse, triangle, and pentagon indicate 2-fold-, 3-fold-, and 5-fold-symmetry axes, respectively. Bar, 10 nm. (C and D) Isosurface representation of HVTV-1 (C) and HSTV-2 (D) capsid reconstructions along an icosahedral 2-fold axis. The capsids are displayed at a threshold of a sigma value of 3.0. The symmetry axes are shown as in panel A. Coloring was done using radial-depth cueing (bar, 325- to 425-Å radius) in UCSF Chimera (54).

