Fig 3.
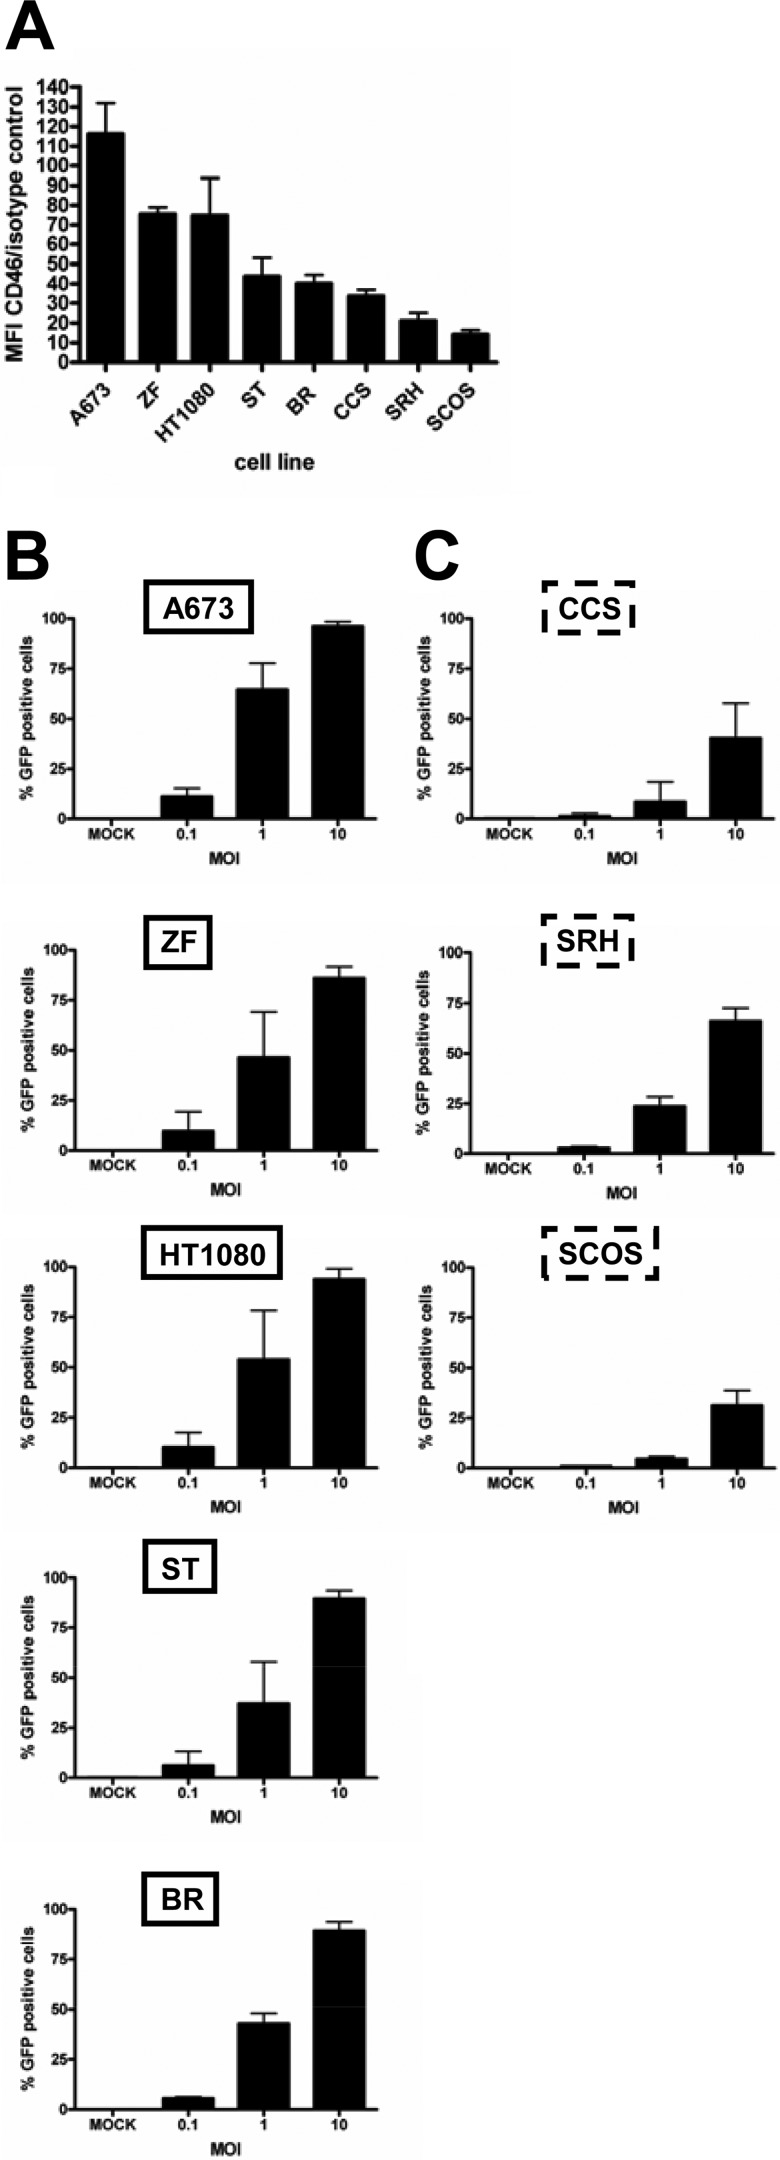
Receptor expression and primary infection rates. (A) Sarcoma cell lines were stained with anti-CD46 antibody or an isotype control. Expression was analyzed by flow cytometry. MFI indicates the ratios of the arithmetic means of the CD46 staining/isotype control. Means and SEM from three independent experiments are shown. Susceptible (B) and resistant (C) sarcoma cell lines were infected with MeV-GFP at MOIs of 0.1, 1, and 10 or were mock infected. At 24 hpi, the percentage of GFP-expressing cells was determined by flow cytometry.

