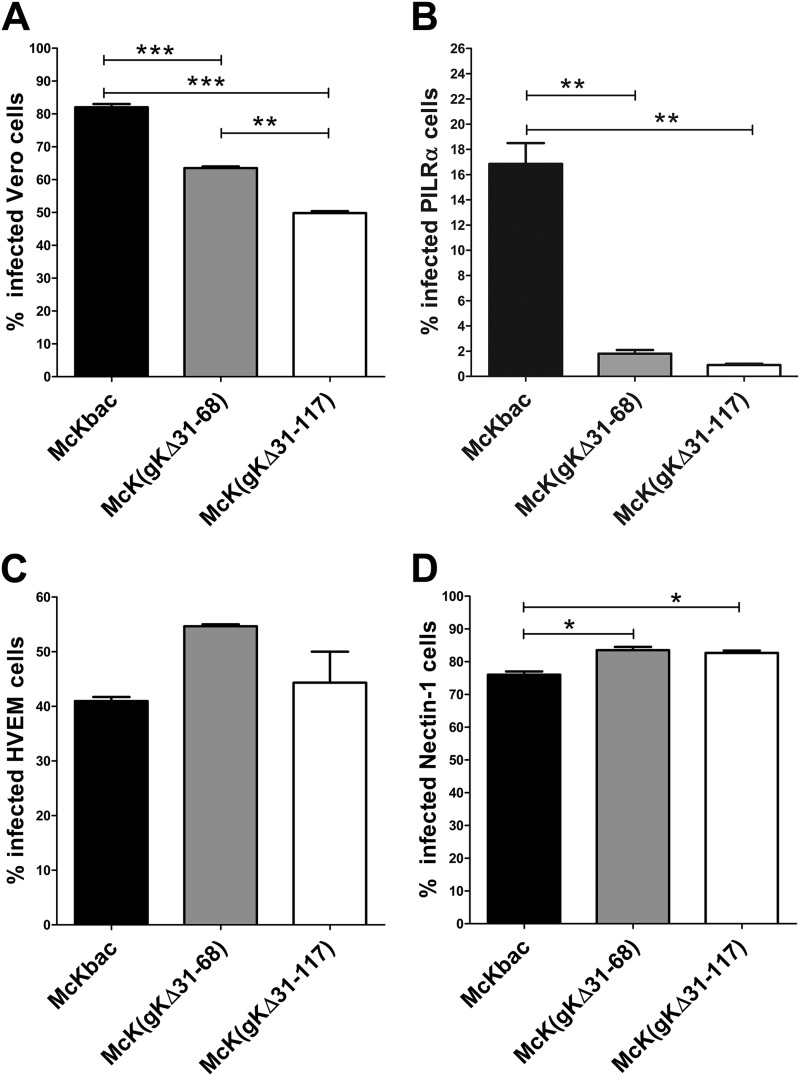
Fig 4.
Comparison of entry efficiencies of McKbac and gK mutant viruses. (A) Entry into Vero cells. (B) Entry into CHO-PILRα cells. (C) Entry into CHO-HVEM cells. (D) Entry into CHO-nectin-1 cells. All cells were infected with McKbac and the gK mutant viruses gKΔ31-68 and gKΔ31-117 at an MOI of 1. At 8 to 12 hpi, the cells were stained with anti-ICP4 antibody and analyzed by flow cytometry to determine the percentage of infected cells. Comparison of groups was performed by one-way ANOVA (see Materials and Methods). P ≤ 0.05 is considered significant. *, 0.01 < P ≤ 0.05; **, 0.001 <P ≤ 0.01; ***, P ≤ 0.001.

