Fig 3.
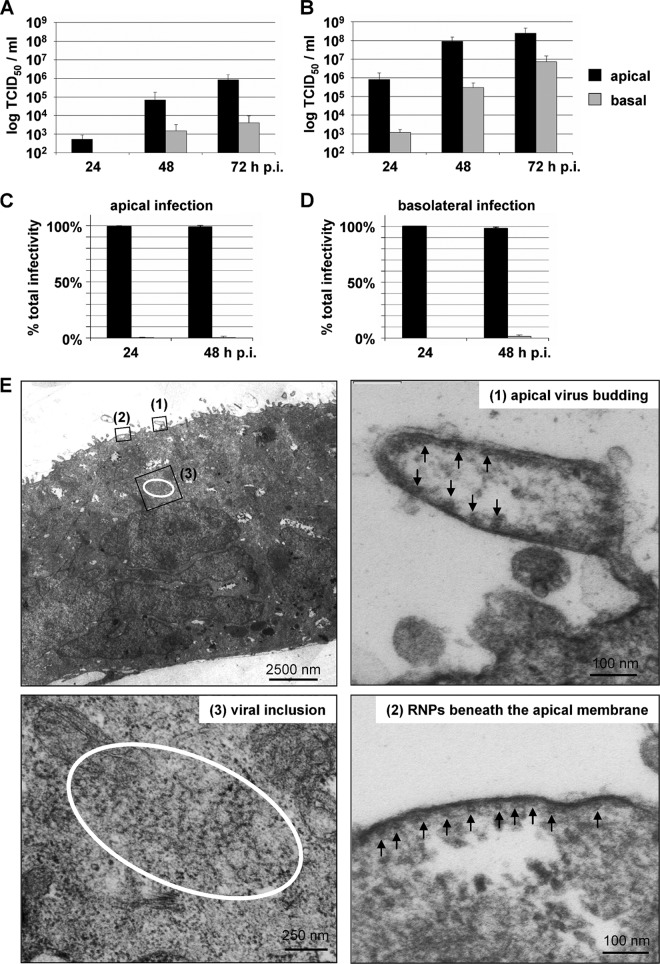
NiV release from infected polarized MDCK cells. (A and B) MDCK cells were cultivated on permeable filter supports for 5 days and infected from the apical side at an MOI of 0.01 (A) or an MOI of 10 (B). Cell-free virus in the apical and basal media was titrated by the TCID50 method at 24, 48, and 72 h p.i. (n = 3). (C and D) Polarized MDCK cells were infected from either the apical (C) or basal (D) side at an MOI of 10. Virus yields in the apical and basal media were determined at 24 and 48 h p.i. The percentages of total infectivity in the apical and basal media (n = 3) are shown. Error bars indicate standard deviations. (E) NiV-infected polarized MDCK cells were fixed and processed for transmission electron microscopy at 24 h p.i. The top left panel shows an overview of a NiV-positive syncytium. Top right and bottom panels show higher magnifications of boxed areas showing an apical virus bud (1), nucleocapsids (RNPs) aligned at the apical plasma membrane (2), and a viral inclusion (3). Arrows indicate cross-sectioned viral RNPs.

