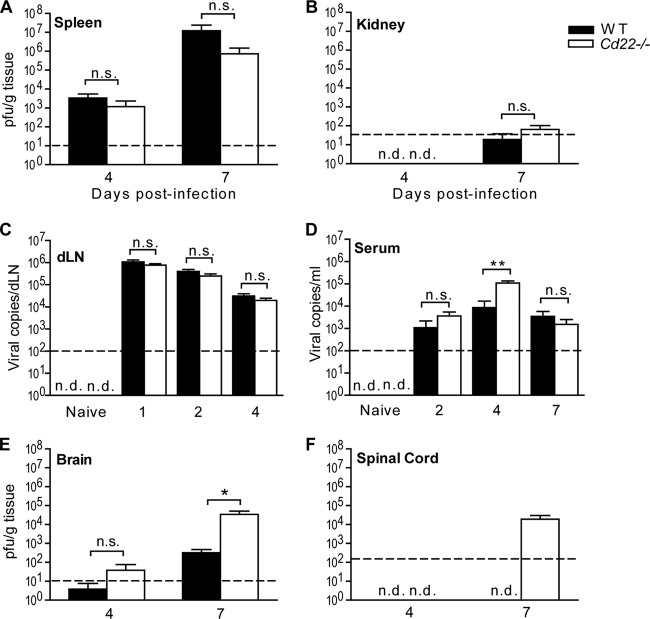
Fig 2.
Increased viral titers in the CNS and serum of WNV-infected Cd22−/− mice. Viral titers were determined using a standard plaque assay (A, B, E, and F) or quantification using real-time qPCR (C and D). Mice were inoculated as described in the text and tissues harvested at the indicated days p.i. Graphs show PFU of virus plaqued per gram of tissue or copies of viral RNA. Dotted lines show limits of detection. Statistics were performed using a Mann-Whitney U test of the median. *, P < 0.05; **, P < 0.01. n.s., not significant; n.d., not detected. Data are shown for 6 to 10 mice per time point per group.

