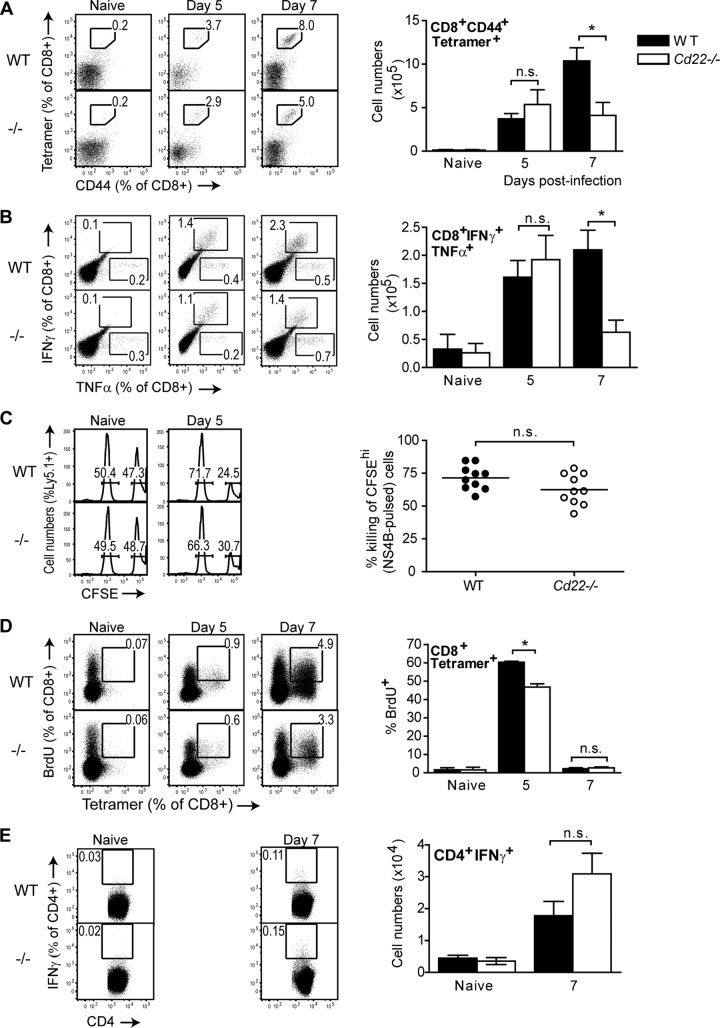
Fig 4.
Impaired WNV-specific CD8+ T cell responses in the spleens of infected Cd22−/− mice. Splenocytes were harvested from naive or infected WT or Cd22−/− mice at various time points after infection. (A) Tetramer staining. Total splenocytes were stained with surface markers for CD8+ T cells, NS4B-specific MHC I tetramer, and CD44. Tetramer+ CD44+ CD8+ T cells are quantified in representative dot plots as frequency of CD8+ cells (left dot plots) or in cell numbers (right bar graph). (B) CD8+ T cell ICS. Total splenocytes were restimulated ex vivo with 1 μM NS4B peptide as described in Materials and Methods. Data are shown as IFN-γ+ TNF-α+ cells as a frequency of total CD8+ T cells (left dot plots) and total cell numbers of CD8+ IFN-γ+ TNF-α+ populations (right bar graphs). (C) In vivo cytotoxicity assays were performed at described in Materials and Methods. CFSE-labeled unpulsed (CFSE-low) and NS4B-pulsed (CFSE-high) Ly5.1+ splenocytes were transferred into naive WT or Cd22−/− mice or into WT or Cd22−/− mice infected 5 days earlier with WNV; 2 h later, splenocytes were isolated and stained for surface Ly5.1 expression. (Left histograms) Representative histograms show CFSE-low and -high populations as a frequency of total Ly5.1+ cells. (Right graph) Each symbol represents percent killing of NS4B-pulsed Ly5.1+ target cells in an infected WT or Cd22−/− mouse. (D) In vivo BrdU incorporation assay. Naive and day 5 and 7 infected WT and Cd22−/− mice were injected with BrdU i.p. as described in Materials and Methods. Data are shown as BrdU+ tetramer+ cells as a frequency of total CD8+ T cells (left dot plots) and frequency of CD8+ tetramer+ cells that are BrdU+ (right bar graphs). (E) CD4+ T cell ICS. Total splenocytes were restimulated ex vivo with overnight with 1 μM NS3 peptide prior to ICS to detect IFN-γ in CD4+ T cells. Data are shown as IFN-γ+ cells as a frequency of total CD4+ T cells (left dot plots) and cell numbers of CD4+ IFN-γ+ populations (right bar graphs). Data show one representative of three independent experiments with at least three mice per group per time point. Statistics were performed using Student's t test. *, P < 0.05. n.s., not significant.

