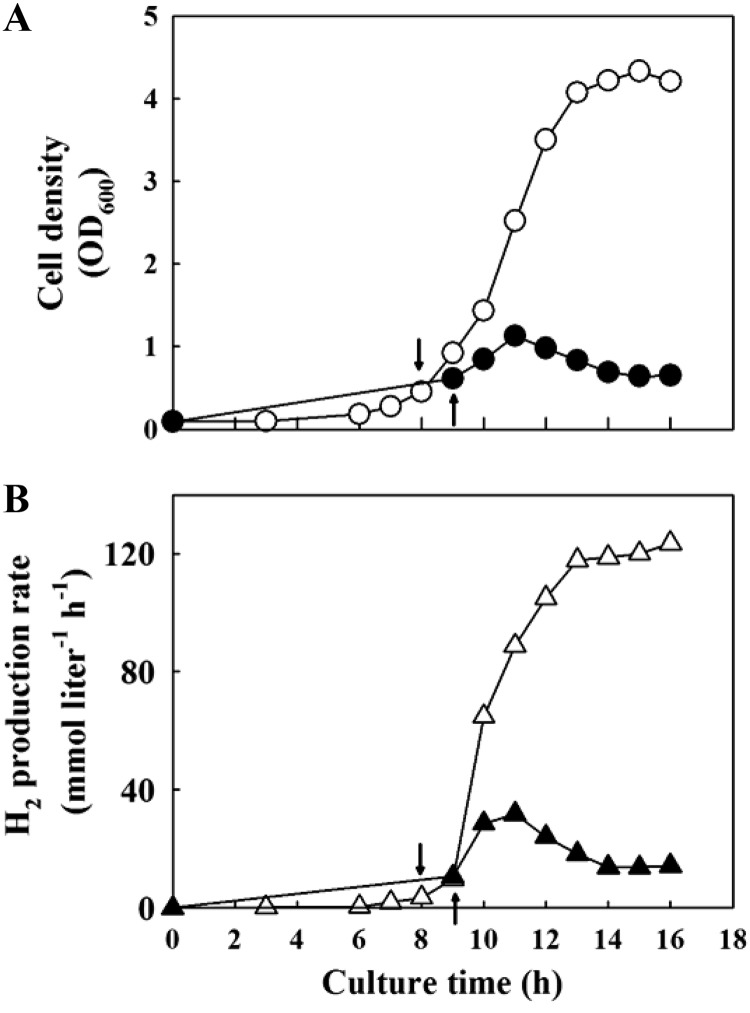
Fig 4.
Growth (A) and H2 production (B) of wild-type strain (closed symbols) and MC01 mutant (open symbols) in a 3-liter bioreactor with CO supplied at 240 ml min−1 of flow rate. Cell growth was monitored by measuring optical density at 600 nm (OD600). The initial CO flow rate of 20 ml min−1 was raised to 240 ml min−1 when the OD600 reached about 0.3, as indicated by arrows.

