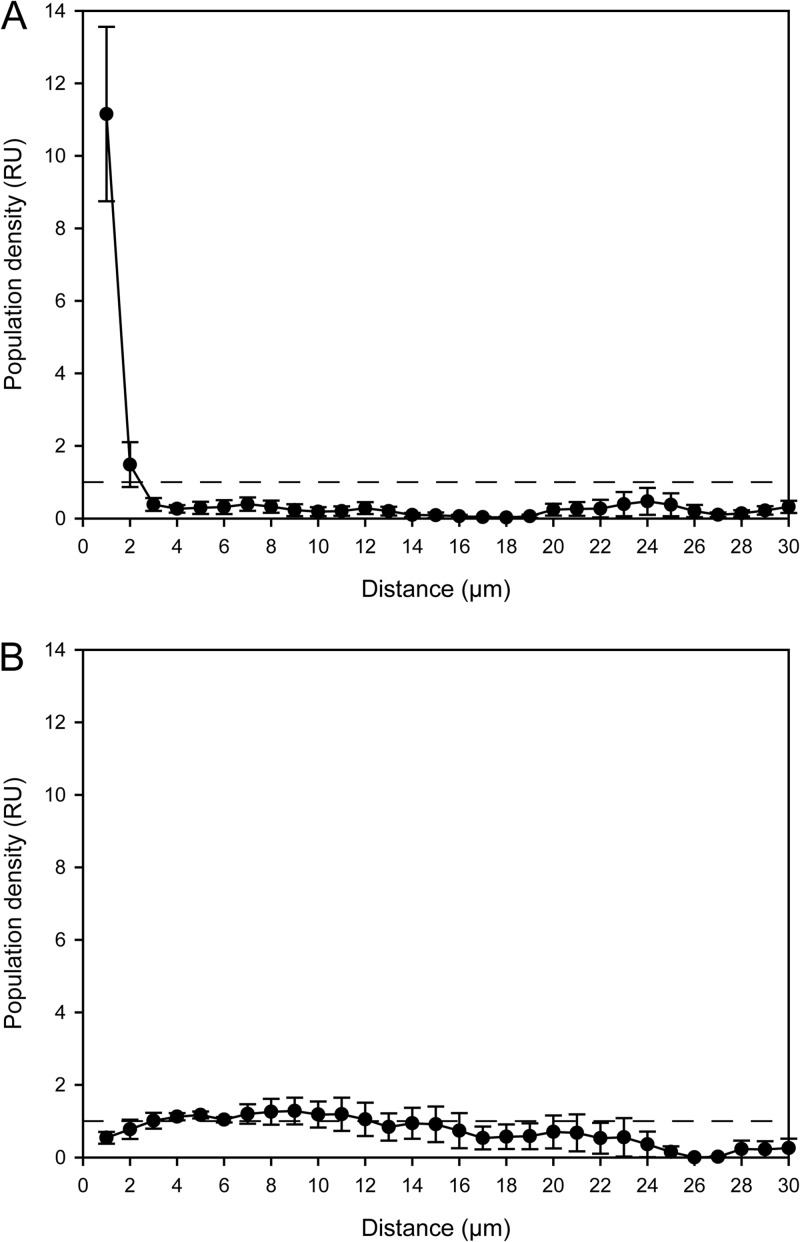
Fig 5.
Spatial arrangement pattern analysis of the Micavibrio-like organism and nitrifiying bacteria. In either plot the horizontal dashed line (y = 1) indicates random distribution at the respective distance. Values above this line indicate coaggregation (i.e., the Micavibrio-like cells were more abundant at these distances than expected for randomly distributed populations). Values below this line indicate that the Micavibrio-like cells were less abundant at these distances than expected for randomly distributed populations. Error bars show the standard errors of the means (n = 4). RU, relative units. (A) Coaggregation of Micavibrio-like bacteria with sublineage I Nitrospira; (B) lack of coaggregation between Micavibrio-like bacteria and sublineage II Nitrospira.

