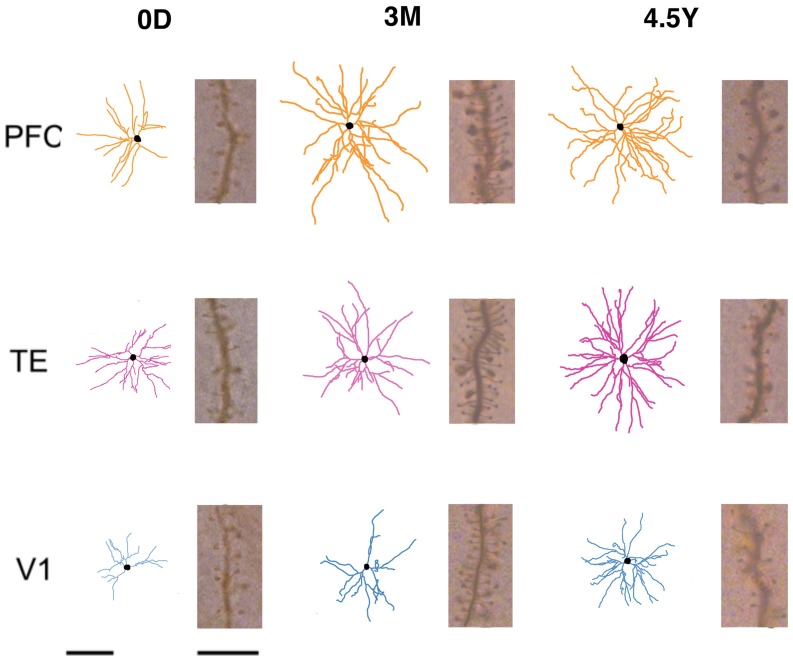
Figure 2.
Skeletonized, tangential, reconstructions of the basal dendritic trees of layer-III pyramidal cells (in the tangential plane) sampled from the primary visual (V1), inferior temporal visual association (TE), and prefrontal (PFC) cortices at day 0 (0D), 3 months (3M), and adulthood (4.5Y). The illustrated cells represent the average of all cells sampled for each cortical area/age group. Insets illustrate the spine density for cells of each cortical area/age group at 50–70 μm from the cell body. Left Scale Bars = 100 μm (for all of skeletonized reconstructions of the basal dendritic trees of pyramidal cells), Right Scale Bars = 10 μm (for all of Insets illustrate the spine density for cells of each cortical area/age group at 50–70 μm from the cell body).

