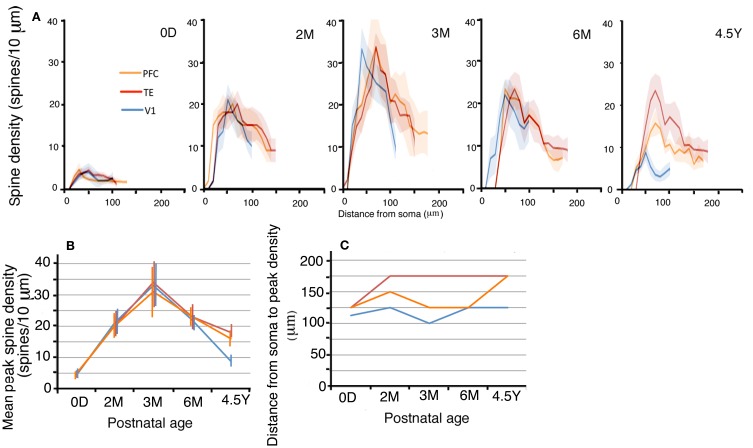
Figure 5.
(A) Profiles of the spine densities of the basal dendrites of layer-III pyramidal cells as a function of distance from soma. The shaded areas indicate the standard deviations. The peak density (spine number/10 μm) (B), the distance from the soma to the position of peak density (C) of layer-III pyramidal cells in V1, TE, and PFC at 0D, 2M, 3M, 6M, and 4.5Y. Error bars indicate standard deviations.

