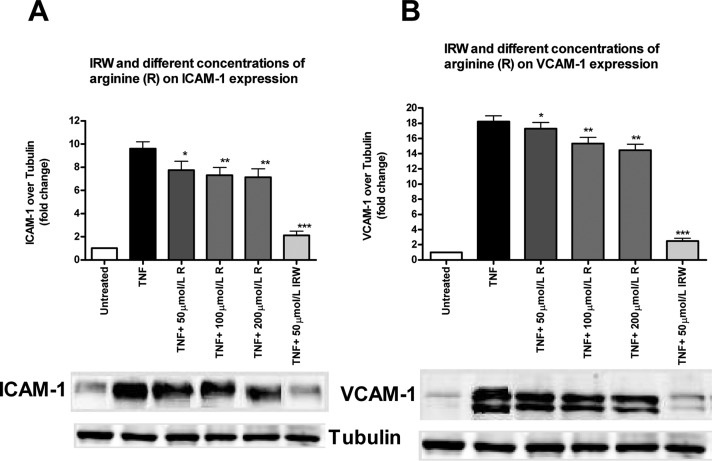
Figure 4.
Effect of various concentrations of arginine on TNF-induced ICAM-1 and VCAM-1 expression: (A) various concentrations (50, 100, and 200 mol/L) of arginine (R) and IRW (50 mol/L) on ICAM-1 expression; (B) various concentrations (50, 100, and 200 mol/L) of arginine (R) and IRW (50 mol/L) on VCAM-1 expression. ICAM-1 and VCAM-1 protein levels are expressed as fold increase over the untreated control. Bars represent mean values (mean ± SEM, n = 8 independent experiments). Representative Western blots are shown below. (∗∗∗) P < 0.001, (∗∗) P < 0.01, and (∗) P < 0.05, compared to TNF alone. Bar graph having lighter color indicates that a particular treatment has a significant effect compared with TNF alone.

