
Figure 5. Mitochondrial canine amplicon.
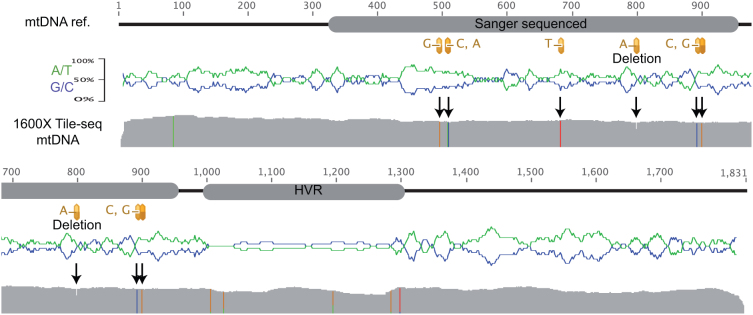
Top shows a schematic representation of the amplicon. Left grey box indicate the region validated by Sanger sequencing and the variants detected shown below in yellow, right grey box show the highly variable repeat region (HVR). The protected end was incorporated on the left side of this amplicon. Middle: base composition in 20 bp sliding window (G/C blue, A/T green). Bottom: Tile-seq coverage with agreeing variants to Sanger calls (arrows), and additional non-validated variants by coloured columns in the coverage plot. The reference and results are displayed over two rows.