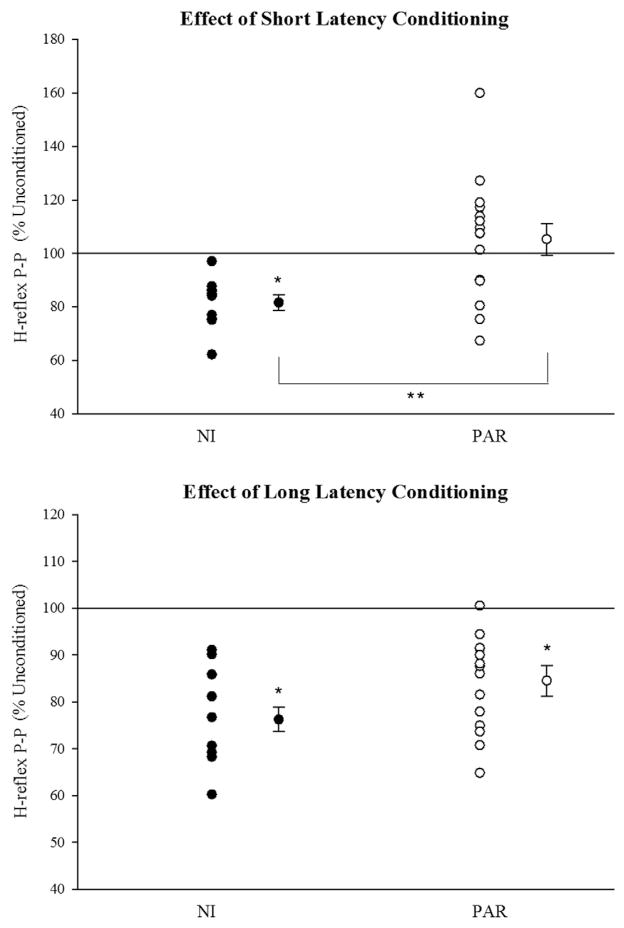
Fig. 2.
Maximum response to short and long latency conditioning. Mean (±SE) values are shown for each group. Single and double asterisks represent significant within and between group effects, respectively. Individual responses are shown to the left of the mean data and represent the mean of the maximum short latency response observed for each subject. NI = neurologically intact, PAR = paretic.

