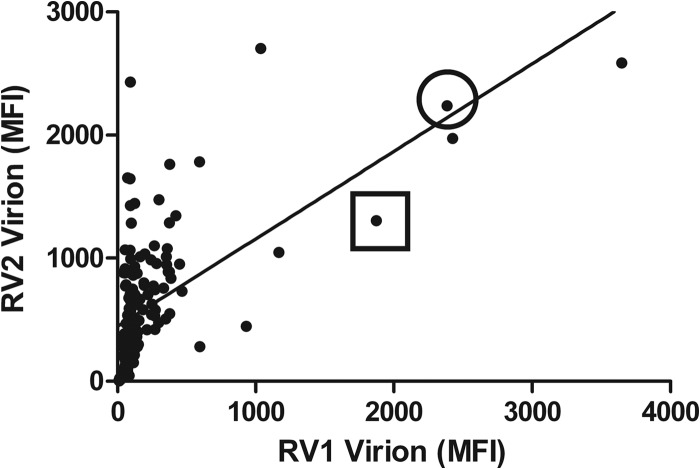
Fig 9.
Correlation of RV1 and RV2 virion seroreactivity. The RV1 and RV2 virion results from the multiplex Luminex assay of Fig. 4 were compared. The Pearson's correlation analysis was employed to determine the correlation between the RV1 and RV2 seroreactivity. n = 212 serum samples, R = 0.5939, P < 0.0001 (two-tailed), significant at the 0.05 level. Two animals from the SIV vaccine study, M02298 (square) and M03126 (circle), were chosen for longitudinal analysis in Fig. 10.

