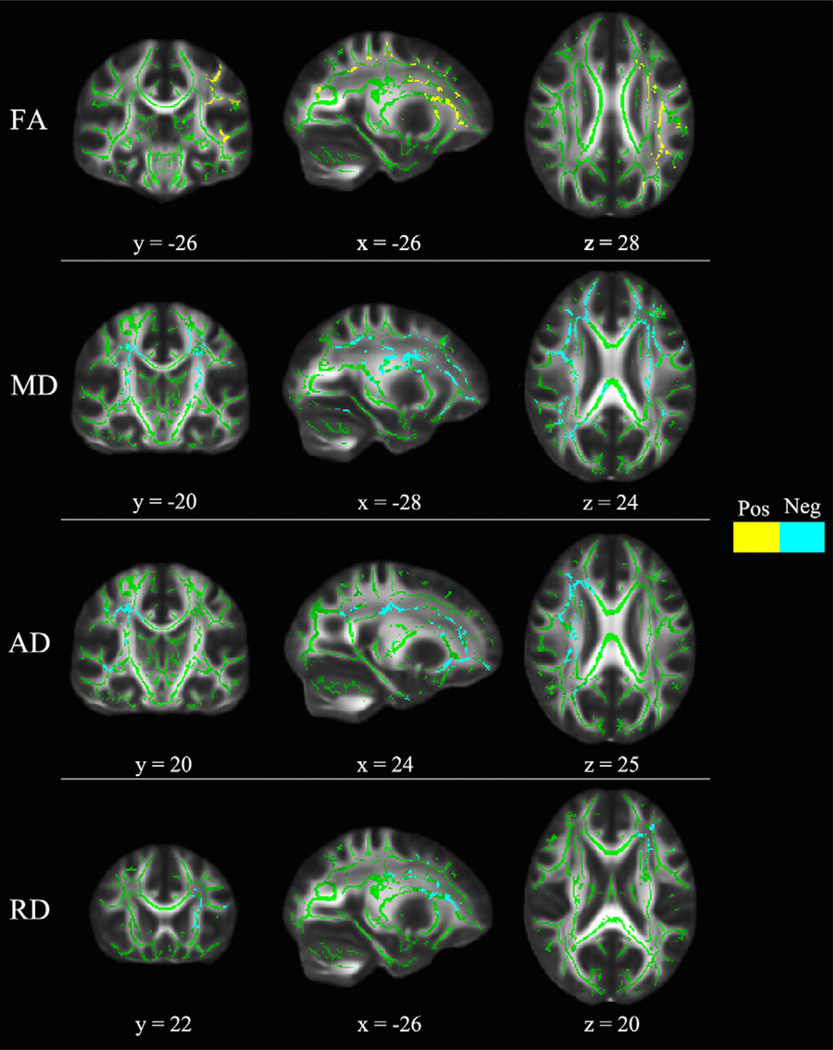
Fig. 4.
TBSS results of significant age effects (p < 0.05, corrected) in each diffusion index corresponding to Table 4. The results from age effect are superimposed on the fiber skeleton (Green) and overlaid on the FMRIB FA template. Yellow represents increases with age and cyan represents decreases with age using data from both boys and girls. Note the age trend for FA was merely driven by data from boys. Images are in radiological convention. x: right ↔ left direction; y: anterior ↔ posterior direction; z: superior ↔ inferior direction.

