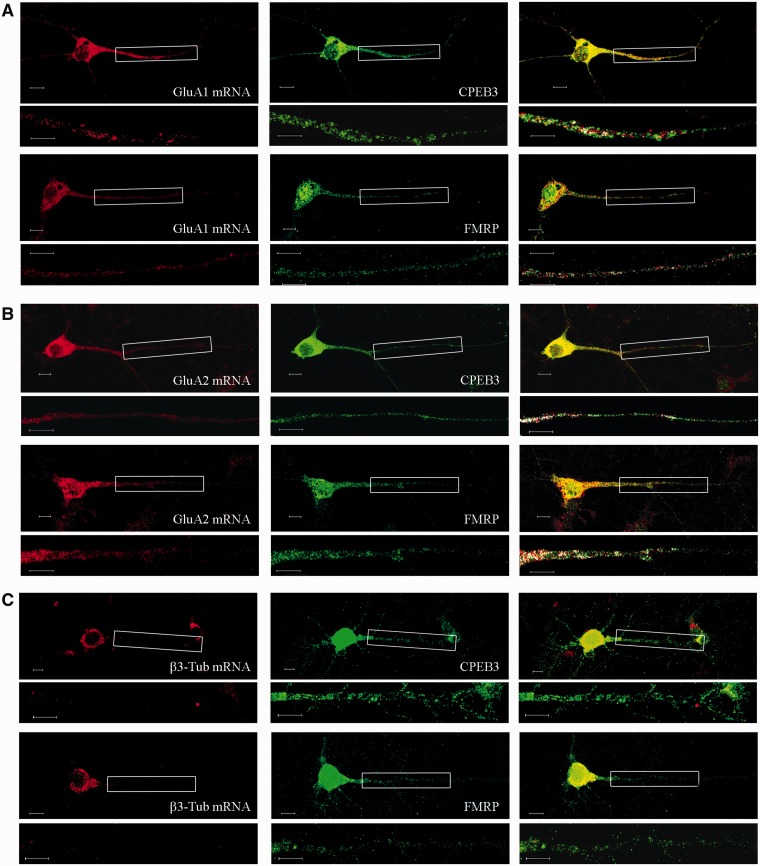
Figure 4.
Fluorescence in situ analysis of GluA1 (A), GluA2 (B) and β3-Tub (C) mRNA (red—left panel) is reported together with immunostaining with FMRP and CPEB3 (green—middle panel). The merged images are reported in the right panel. Magnifications of boxed dendritic regions are reported under each figure; the artificial white color shows co-localization of the mRNA and protein signals. Scale bar is 10 µm.

