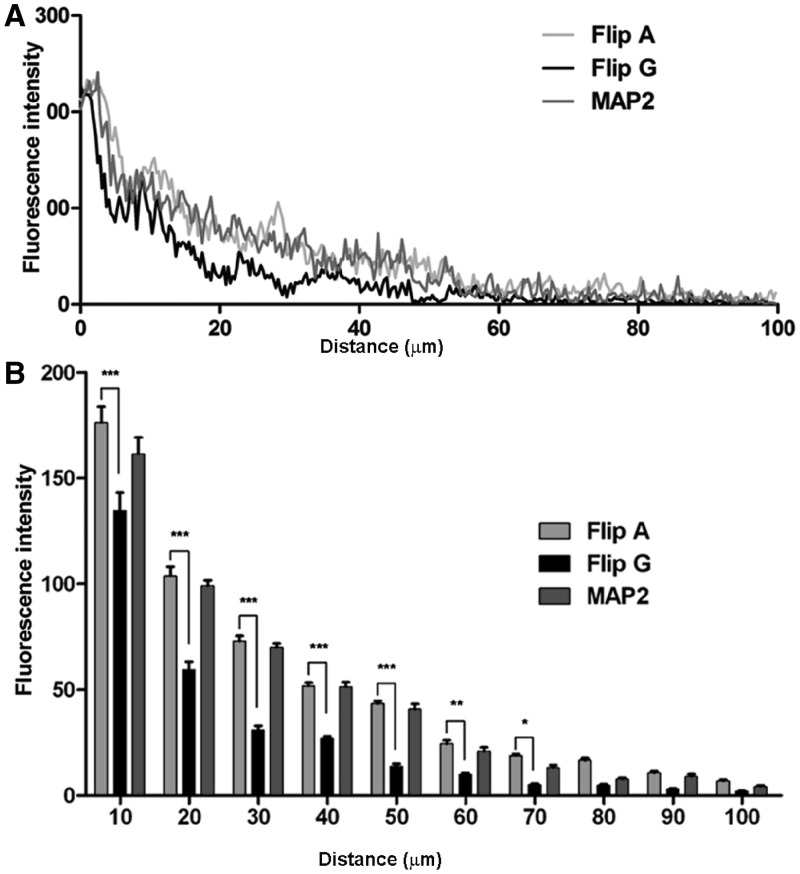
Figure 9.
(A) Histogram showing the quantification of chimeric transcripts dendritic localization. The mean fluorescence intensity in dendrites up to 100 µm from the cell soma has been reported for the different chimeric mRNAs (n ≥ 20). (B) Histogram showing the mean fluorescence intensity in dendritic regions of 10 µm in length, up to 100 µm from the cell soma (n ≥ 20).

