Figure 5.
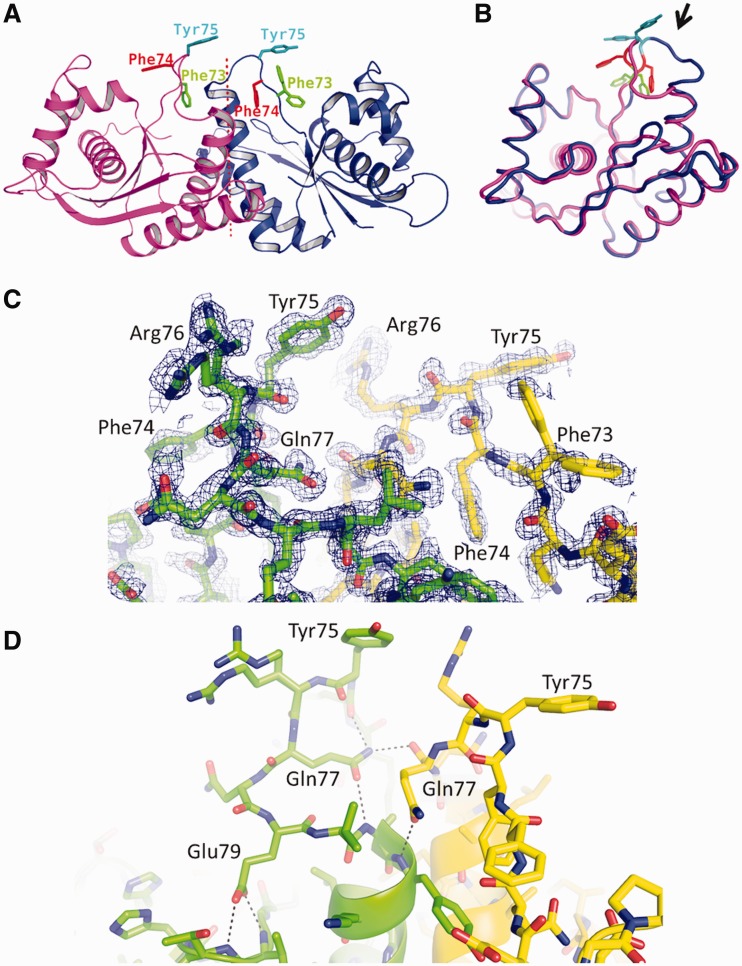
The asymmetric loop. (A) Ribbon diagram of the T.th. RuvC dimer, with the aromatic residues in the asymmetric loop region Phe73, Phe74 and Tyr75 shown in sticks. (B) Superposition of the two T.th. RuvC molecules from the asymmetric dimer, with Phe73, Phe74 and Tyr75 colored as in (A). The loop region with the greatest conformational difference between the two molecules is highlighted by an arrow. Deviations of the Cα positions in this superposition are shown in Supplementary Figure S6. (C) Electron density for the asymmetric loops. Simulated annealing composite omit 2Fo-Fc map within 1.7 Å from the protein atoms is shown, contoured at 1.0σ. Arg76 from one of the molecules and Phe73 from the other molecule show multiple conformations. (D) Hydrogen-bonding network involving Gln77 and Glu79 stabilizes the asymmetric conformations of the loops. The hydrogen bonds are indicated by the dotted lines.

