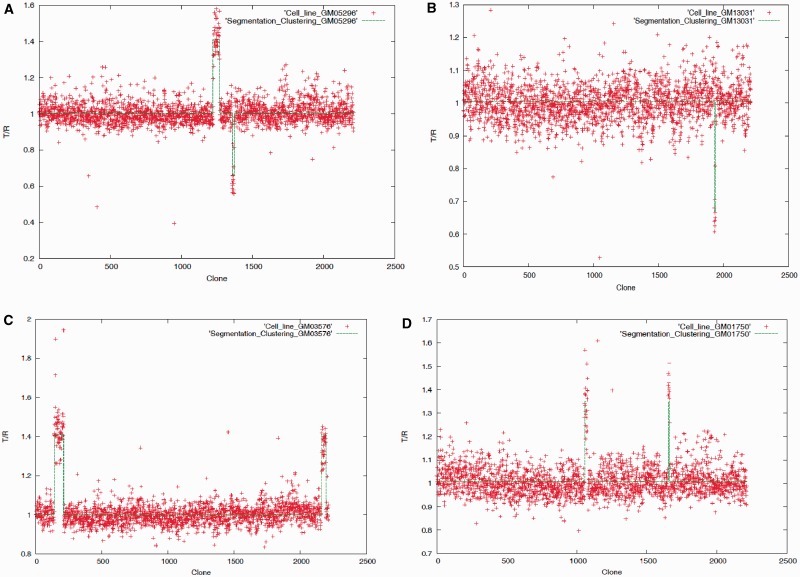
Figure 9.
Plot of the aCGH data (T/R ratios, T and R stands for tumor and reference sample,respectively, plotted against the aCGH clone number from chromosome 1 through chromosome 22) for cell lines (A) GM05296, (B) GM13031, (C) GM03576 and (D) GM01750; the recursive segmentation method was first applied to detect the boundaries of the copy number variants followed by an agglomerative clustering for grouping similar variants.

