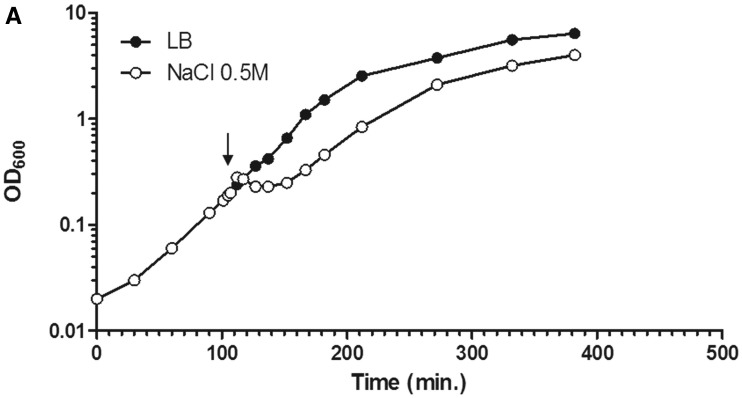
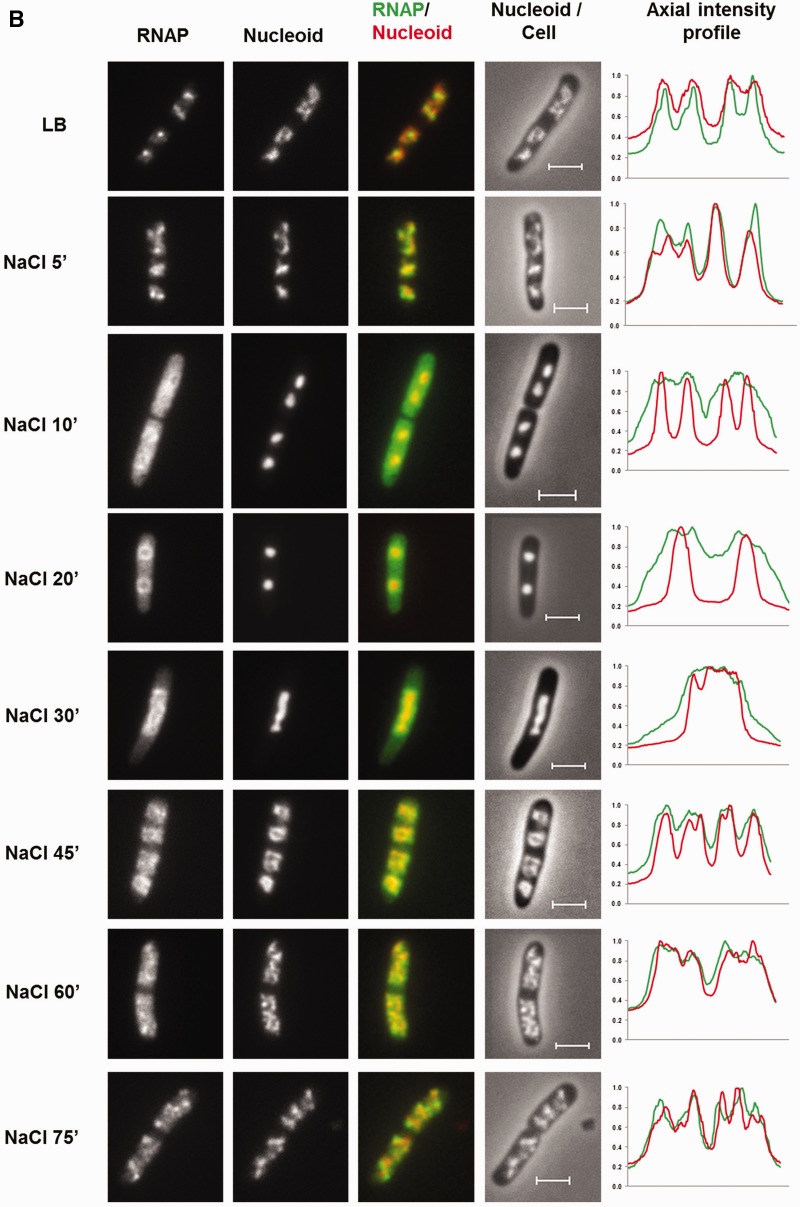
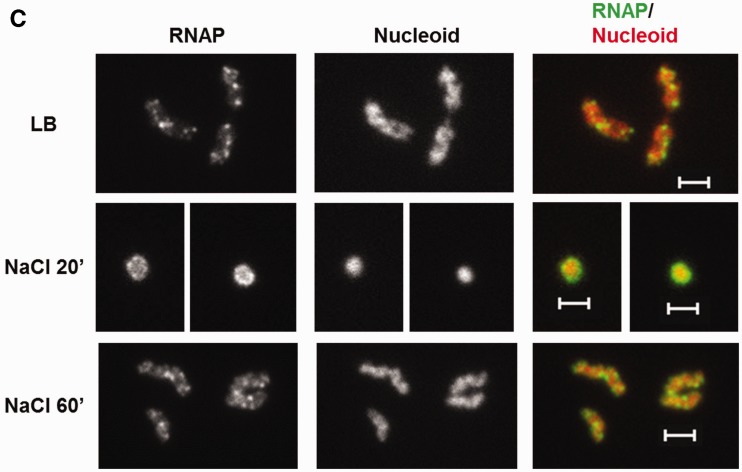
Figure 1.
Dynamic interaction of RNA polymerase and DNA during the osmotic stress response. (A) Growth curve of CC72 cells in LB (close circle) and after osmotic shock in mid log phase (open circle). The arrow indicates the induction of the hyperosmotic response.(B) Distribution of RNAP and nucleoid structure during hyper-osmotic response. RNAP-venus protein fusion, nucleoid, overlay of RNAP (green) and nucleoid (red), overlay of nucleoid (white) and cell (black) before (LB) or after osmotic shock (NaCl 5′ to NaCl 75′). Axial intensity profile for RNAP (green) and DNA (red) from the cell shown is also included, in which cumulative relative intensity from the short axis of the cell (y-axis) is plotted against the position along the long axis (pole-to- pole) of the cell (x-axis). The RNAP rapidly dissociates from the nucleoid, and the released RNAP occupies the entire cytoplasmic space shortly after osmotic shock (NaCl 10′). The nucleoid becomes hyper-condensed at the same time. Afterwards, the freed RNAP gradually re-associates with the genome over time by first forming a ring (a 2-D picture) at the surroundings of the hyper-condensed nucleoid (NaCl 10′ to NaCl 30′) before penetrating the interior (NaCl 45′). (C) The nucleoids released from the lysed cells in LB, 20 (NaCl 20′) and 60 min (NaCl 60′) after salt addition maintain the same features as that in the intact cells shown in (B). RNAP, nucleoid and overlay of RNAP (green) and nucleoid (red) are shown. The bar scale represents 2 µm.


