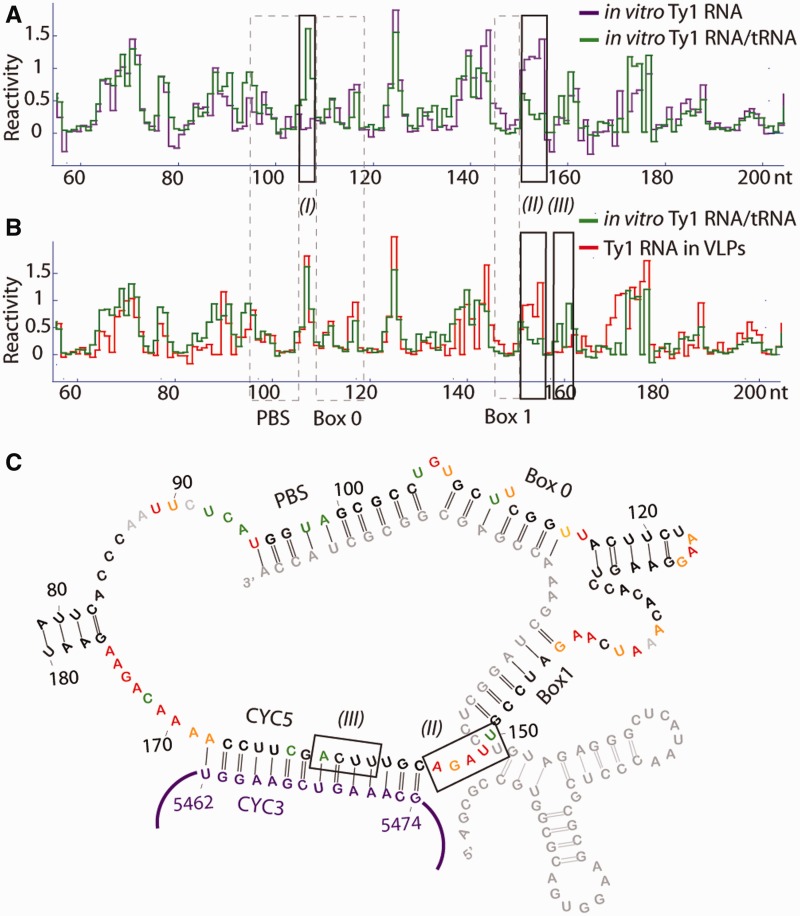
Figure 2.
Structural analysis of the Ty1 PBS region. (A and B) NMIA reactivity plots of ribonucleotides in the PBS region of in vitro transcribed, full-length Ty1 RNA hybridized to tRNA (green), in comparison with that obtained from (A) the same RNA folded in the absence of tRNA (violet), or (B) CNC− VLPs in virio (red). Nucleotide positions corresponding to PBS, Box 0 and Box 1 (13,35) are marked (grey, dashed line). Regions displaying significant changes between each state are noted (I), (II), (III). (C) Model of Ty1 PBS region structure within VLPs. The CYC3 region (15) of the Ty1 genomic RNA is noted (violet).

