
Figure 2.
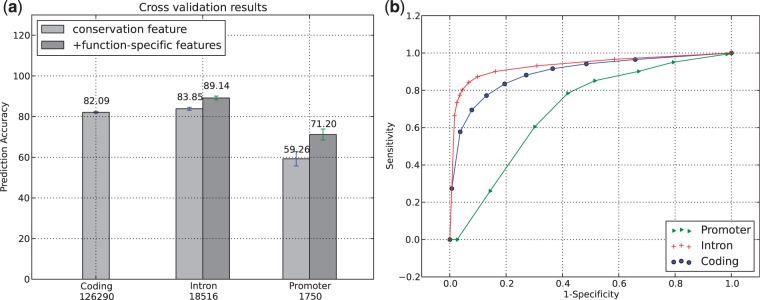
The bar plot on the left shows the 10-fold cross-validation accuracies for each model. Each set of bars refers to a specific gene region. The different shades of gray refer to a different set of features that were used for testing and training. ‘Conservation’ refers to the use of conservation features only, ‘function-specific features’ refers to the use of conservation features in conjunction with additional features (e.g. distance to TSS in promoter regions). The numbers on the x-axis indicate the size of the training dataset. The standard deviation bars demonstrate the variance of the accuracy across the different folds. The plot on the right shows the specificity/sensitivity trade-off using various class membership probability cut-offs to determine class membership on the training data.