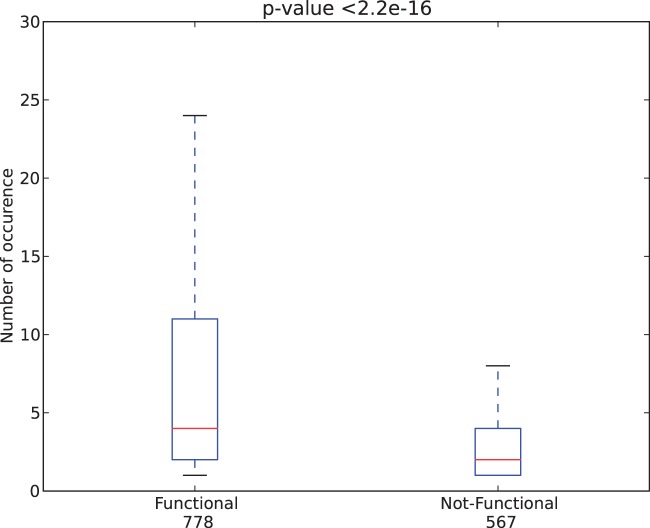
Figure 4.
Box plot demonstrating the difference of the distributions of occurrence of p53-variants in cancer patients. The y-axis shows the number of occurrence of a particular p53-variant in cancer patients. The variants predicted as functional are occurring more frequently in cancer patients (left), than the variants considered to be non-functional (right). P-value is calculated based on the non-parametric Wilcoxon rank sum test. Range of box is defined as the inner quartile range, while the box is split into two parts by the median.

