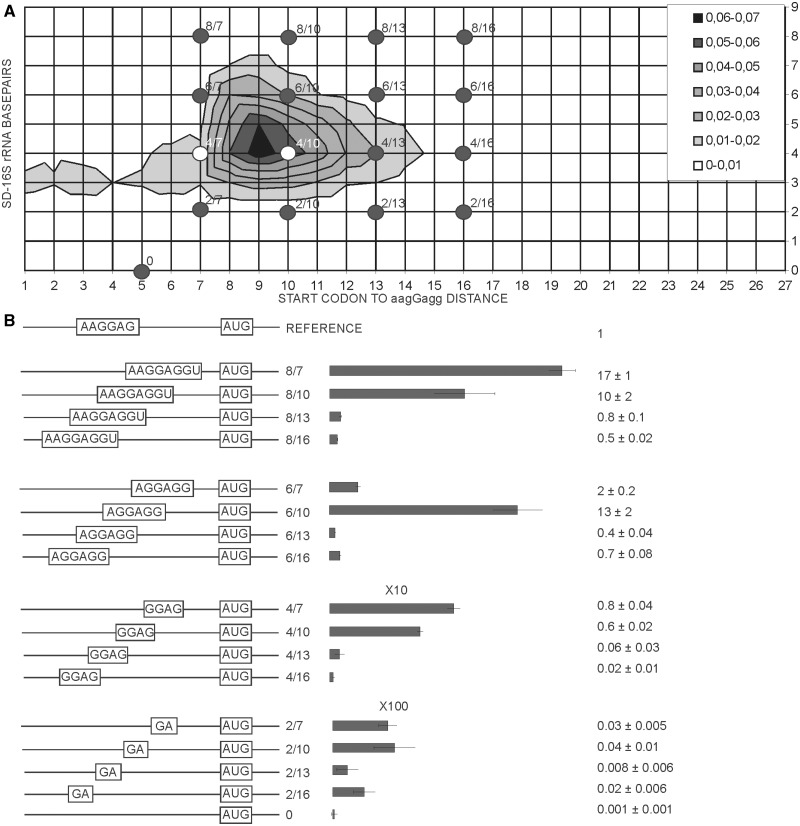
Figure 3.
Influence of SD sequence length and location on expression efficiency. (A) Distribution plot of SD length in basepairs (y-axis) and spacing from aagGagg to the first nucleotide of the start codon (x-axis). Frequency of occurrence of particular variant of translation initation region in the genome of E. coli MG1655 (22) is indicated by a color. The denser is the hue of gray the more frequent is the variant (see the key in the up right corner). Dots on the plot correspond to the constructs tested in this work. (B) Schematic representation (left side of the panel) and translation efficiencies (right side of the panel) of the constructs. All construct designations are indicated next to the schematic representations. Translation efficiencies of the CER reporter were normalized to the reference RFP construct (shown on top of the panel) and indicated as a diagram. Exact values are shown next to the corresponding bars. A scale was changed as indicated for the bottom two graphs for clarity of presentation. Actual sequences could be found in Supplementary Table S1.

