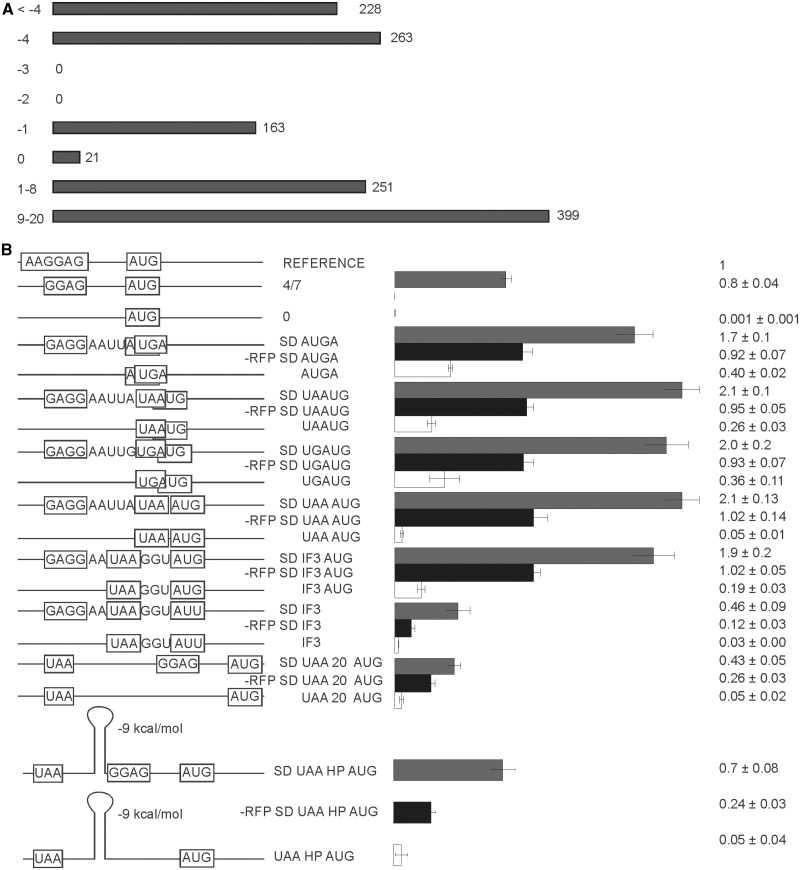
Figure 4.
Translation efficiency of second cistron (CER) in a set of bicistronic constructs. (A) Frequency distribution of intercistronic distances among the E. coli genes located on the same mRNA molecules. (B) Schematic representation (left side of the panel) and translation efficiencies (right side of the panel) of the constructs (similar to those on Figure 1B). All construct designations are indicated next to the schematic representations. Actual sequences could be found in Supplementary Tables S1 and S2. ‘SD’ indicates the presence of the Shine-Dalgarno sequence (gray bars). Construct names devoid of ‘SD’ indicate an absence of the Shine-Dalgarno sequence (white bars). ‘-RFP’ indicates premature termination of the first cistron precluding reinitiation (black bars).

