Figure 1.
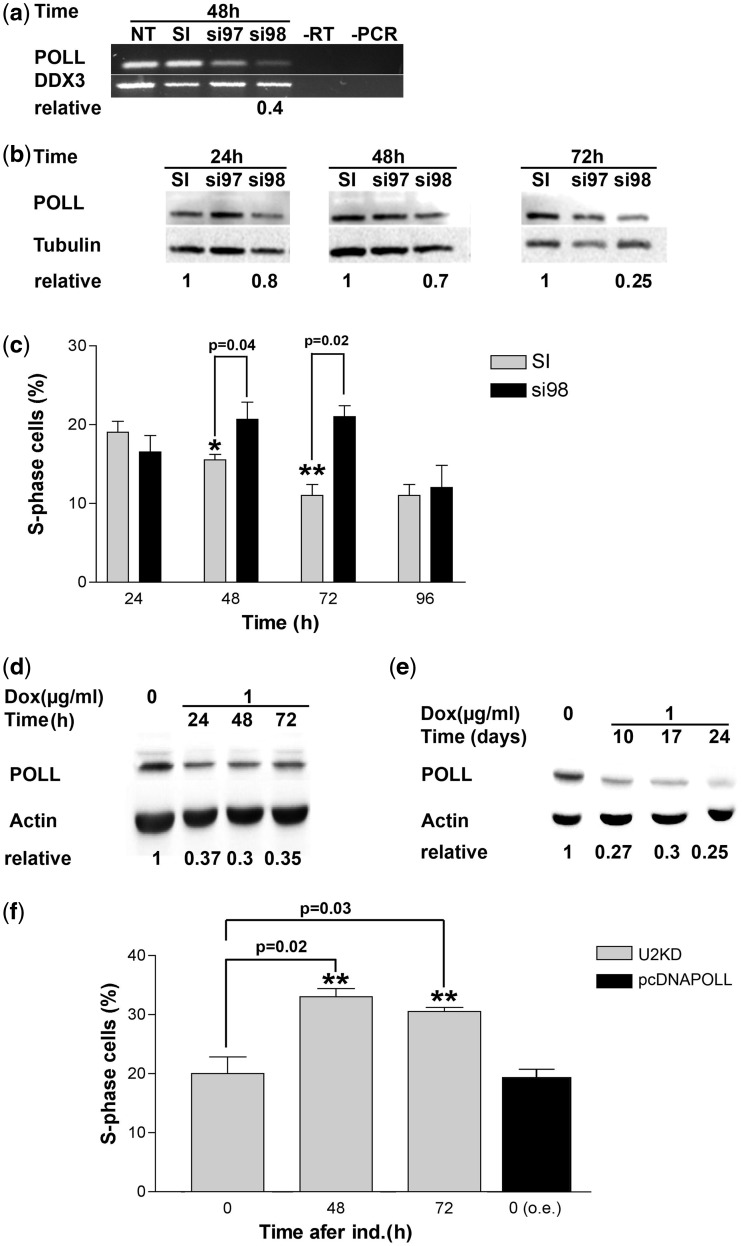
DNA pol λ knockdown induces cell cycle delay. (a) RT–PCR measuring the mRNA levels for the POLL gene in HeLa cells after 48 h from transfection with siRNA oligonucleotides. NT, not transfected; SI, scrambled control; si97, si98, POLL-specific siRNAs. RT, PCR, negative controls. DDX3 (GenBank acc. no. NM_001193417) was used as a reference housekeeping gene. The normalized ratio of the intensity of POLL-specific products in SI versus si98 is indicated on bottom of the panel. (b) Western blot analysis of protein levels of DNA pol λ in HeLa cells after 24, 48 and 72 h from transfection with siRNA oligonucleotides. SI, scrambled control; si97, si98, POLL-specific siRNAs. Tubulin was used as the loading control. The normalized ratios of the intensity of DNA pol λ specific signal in SI versus si98 are indicated on bottom of the panel. (c) Percentage of S phase HeLa cells at different times after transfection with the SI scrambled control or the anti-POLL-specific si98 siRNA as determined by flow cytometry. Each measurement was performed in triplicate. Error bars are SD. P-values were calculated by two-tailed Student’s t-test. (d) Western blot analysis of protein levels of DNA pol λ in U2KDL cells after 24, 48 and 72 h of doxycycline induction. Actin was used as loading control. The normalized ratios of the intensity of DNA pol λ-specific signal in control (t0) versus silenced cells are indicated on bottom of the panel. (e) As in panel d, but at longer time points of induction. (f) Grey bars: percentage of S phase U2KDL cells at different times after doxycycline induction as determined by flow cytometry. Black bar, percentage of S phase U2OS cells ectopically overexpressing DNA pol λ at 48 h. Each measurement was performed in triplicate. Error bars are SD. P-values were calculated by two-tailed Student’s t-test.

