Figure 5.
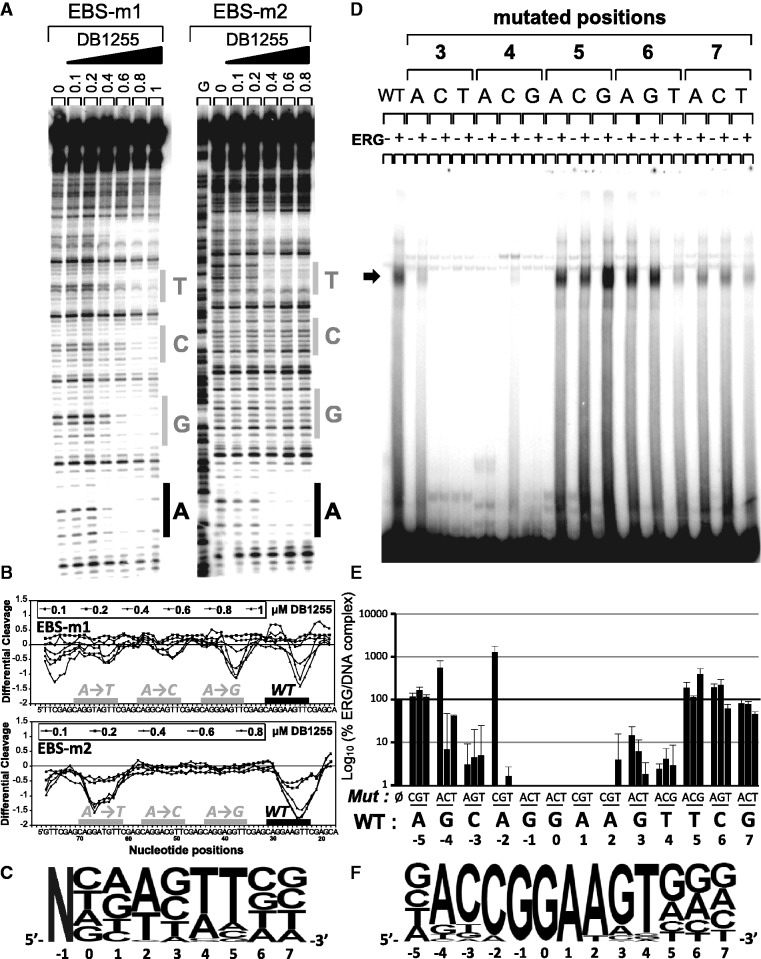
Sequence selectivity of ERG and DB1255 DNA binding. (A) Sequence selectivity of the DB1255/DNA interaction. DNase I footprint assays were performed with a DNA fragment containing three EBS sequences mutated at the indicated positions (positions −1 to +7, DNase I footprint gels and densitometric analyses for the position −1 and 0 and position +3 to +7 are presented in Figure S5A). For each mutation incubation with DB1255 at the indicated concentrations (µM) revealed protected sites of DB1255 interaction. The track labelled “G” is as in Figure S1. (B) Densitometric analyses derived from the gels and EBS-WT (WT) sequence or EBS-mutated sequence are indicated by black boxes or a grey boxes, respectively. (C) The logos were drawn using enoLOGOS (47), where the size of the letter is directly proportional to the binding affinity at 0.8 µM of the compound resulting for densitometric analysis (data shown in Figure S5B). (D) Sequence selectivity of the ERG binding to the EBS-WT sequence. ERG binding sequence selectivity are observed by EMSA using radiolabelled EBS oligonucleotide WT (EBS WT) or mutated (EBS mXN) at the indicated position (position X of base N) incubated with ERG protein expressed in reticulocyte lysate system or empty lysate. EBS sequences with mutated positions from −5 to +7 were evaluated but only the EMSA with mutated positions +3 to +7 are shown here (EMSAs of mutated position −5 to +2 are shown in Figure S6A). (E) Representation of the percentage of ERG/DNA complex derived from the gel quantification as means ± s.e.m. relatively to EBS-WT. (F) The logos were drawn as above (full data presented in Figure S6B).

