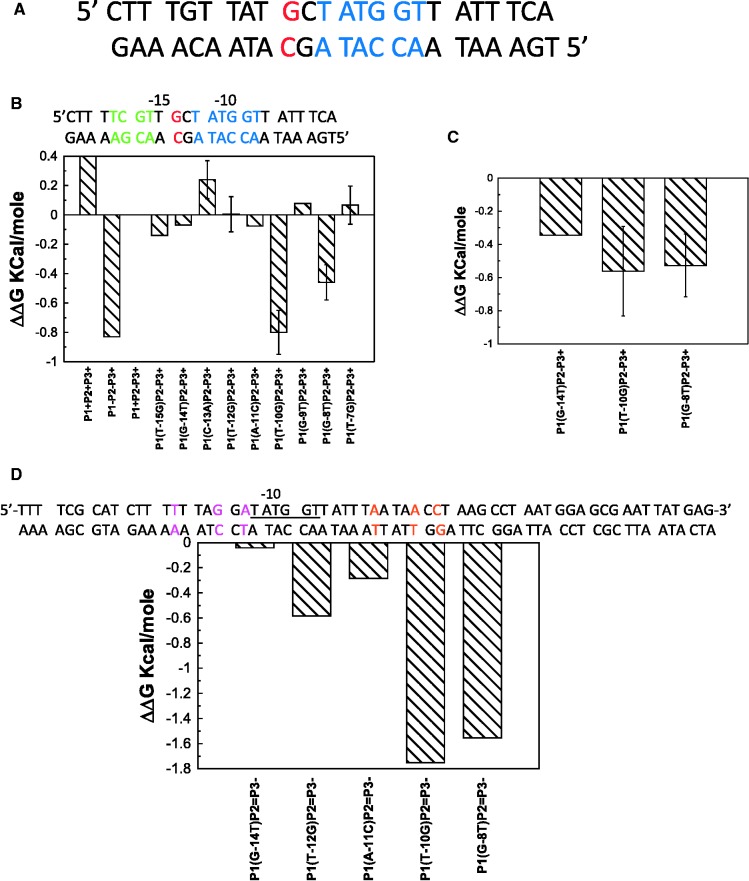
Figure 2.
Effect of single-base pair substitution on galP1 promoter. (A) Sequence of galP1 promoter. The red-colored base is the −14 and the blue-colored bases are the −10 elements. (B) ΔΔG values with respect to galP1+P2−P3+ promoter, plotted for all the single-base pair mutants tested at 4°C. The sequence at the top shows the P2− mutations shown in green. (C) ΔΔG values of selected mutants at 0°C with respect to galP1+P2−P3+ promoter. (D) ΔΔG values of single-base pair mutants in the galP2=P3− background at 4°C. All the experimental conditions are described in ‘Materials and Methods’ section. The sequence above shows the P2= and P3− mutant gal promoter with P2= mutations in magenta color and P3− mutations are in orange color.

