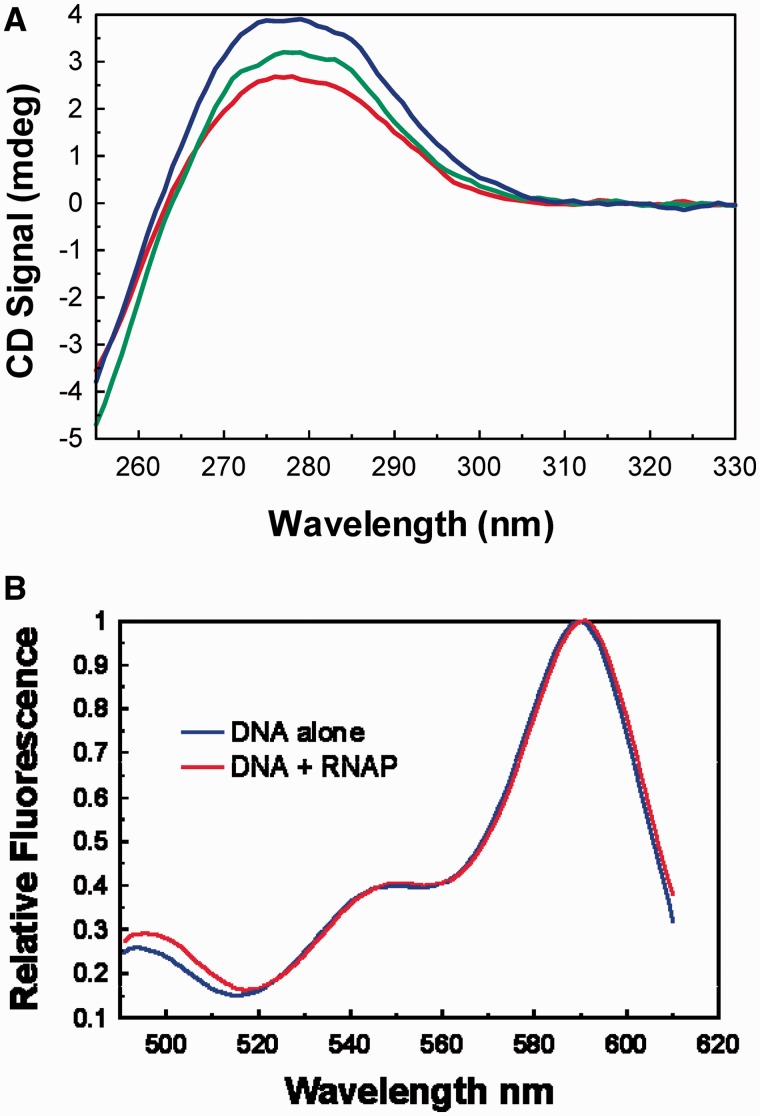
Figure 4.
(A) Circular dichroism spectra of galP1+P2−P3+ DNA (oligo duplex P1) with and without E. coli RNA polymerase (black line), 400 nM RNA polymerase (green line) and 600 nM RNA polymerase (blue line) at 4°C. (B) Fluorescence resonance energy transfer between two ends of a 21-mer DNA (P1–21) encompassing the extended −10 elements of galP1 promoter (+1 to −20; galP1+P2−) at 4°C. The two spectra shown are excitation spectra in which the peaks at 590 nm have been normalized. Donor only spectra and buffer have been subtracted from the excitation spectra of donor + acceptor and acceptor only, respectively.

