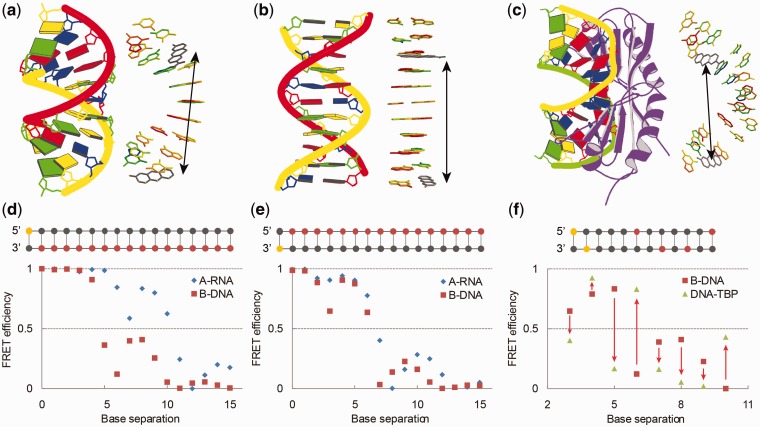
Figure 3.
Demonstration of geometrical model building combined with FRET simulations in three model structures. (a–c) Representative examples of output geometries produced by FRETmatrix (right) along with the block representation of the corresponding structures produced by 3DNA (28) (left). Inserted FRET pairs are shown in grey and marked with arrows. The simulated structures are A-form RNA (a), B-form DNA (b), and PDB entry 1TGH: the complex between the TBP and DNA (c). (d, e) Simulated FRET efficiencies between tCO and tCnitro at selected positions within model structures (Supplementary Data S2). The positions of tCO and tCnitro in the strands are illustrated in top with the position of tCO marked in yellow and the position of tCnitro marked in red. Base separation denotes number of base pairs in between the FRET pair. In (f), red arrows denote change in FRET signal that would occur on binding of TBP to double-stranded DNA.

