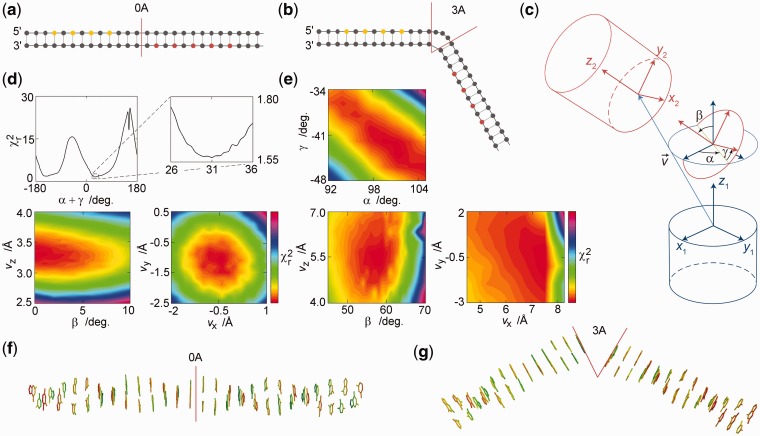
Figure 5.
Using quantitative base–base FRET to reconstruct the 3D structure of nucleic acids. (a) Model system 1: a regular base pair step simulated as a local site in B-DNA. Donor positions are in yellow and acceptor positions in red. (b) Model system 2: a three adenine bulge. (c) Definition of kink parameters. The two helical coordinate systems are the base pair coordinate frames of the two base pairs neighbouring the kink. (d)  surfaces of the 0A system based on the global analysis of 18 donor decays (Supplementary Figure S9). Colour bars: 1.55:1.97 (left) and 1.55:1.78 (right). (e) Global analysis of the 3A bulge system based on the global analysis of 16 donor decays (Supplementary Figure S10). Figures show only the global minimum on the
  surface (Supplementary Figure S11). Colour bars: 1.85:2.12 (top), 1.85:2.39 (bottom left), 1.85:2.90 (bottom right). (f) Optimized 0A structure. (g) Optimized 3A structure.

