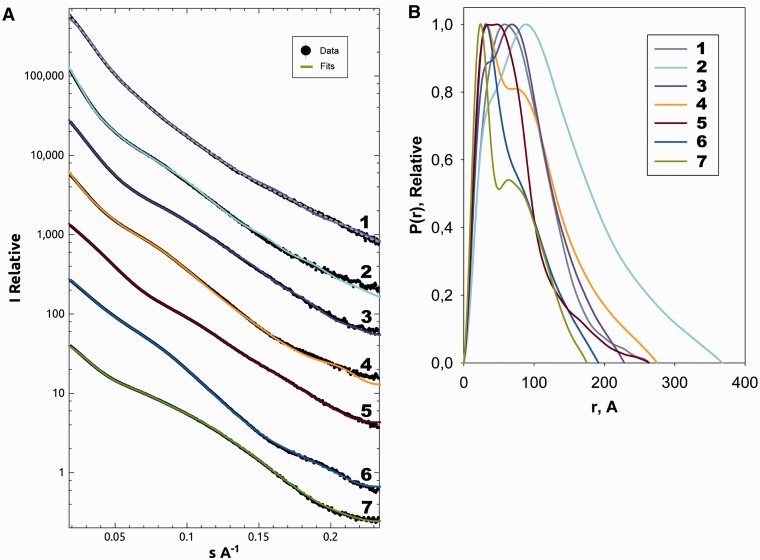
Figure 5.
Scattering curves and distance distribution functions. (A) Experimental scattering curves and the scattering from the structural models; the experimental data are shown in black (with error bars in grey), the ab initio fit for each data set (and the final rigid body refinement for the pentameric complex) in colours corresponding to the structures presented. (B) Distance distribution (p(r)) functions: 1, Pentameric complex MetRS:GluRS:Arc1p:tRNAs (grey-dashed line: ab intio fit, purple: SASREF refined rigid body fit); 2, Trimeric complex of MetRS:GluRS:Arc1p (yellow); 3, GluRS:Arc1p (lilac); 4, MetRS:Arc1p complex (yellow); 5, GluRS (red) the largest of the monomeric complexes; 6, MetRS (blue) slightly smaller than GluRS but both are noticeably bigger then Arc1p; 7, Arc1p (green) is the smallest of the proteins in the complex.

