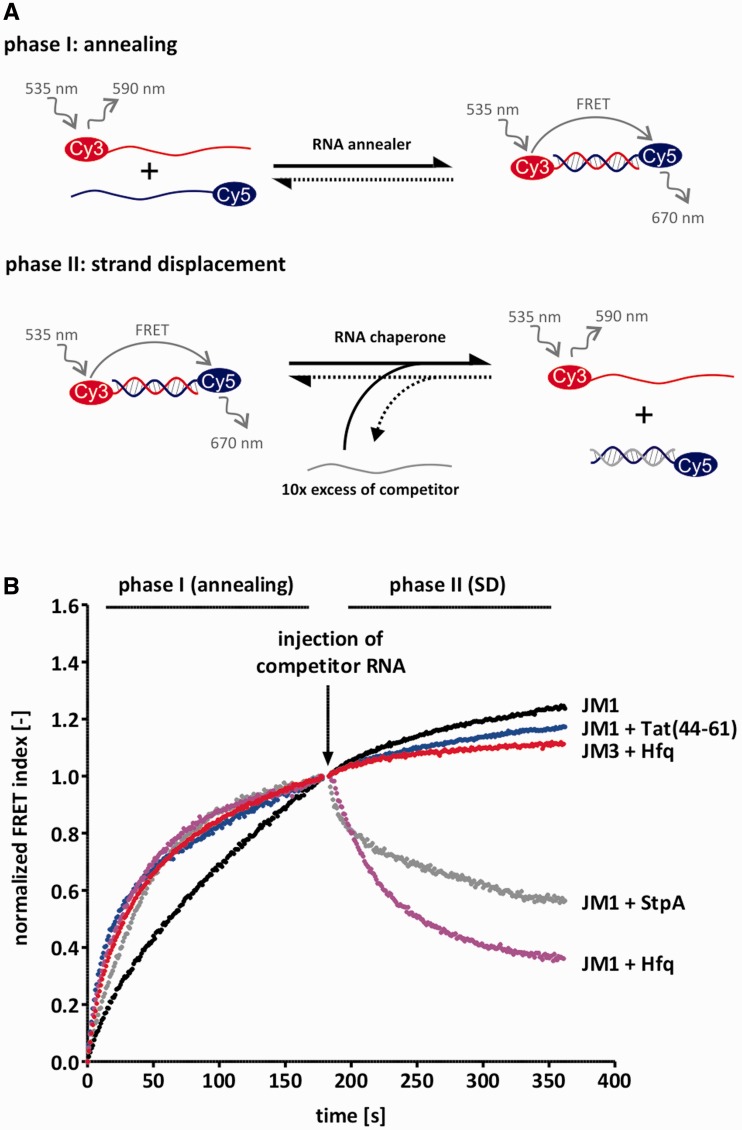
Figure 1.
Tat(44-61) and Hfq catalyse strand displacement and/or annealing. (A) Scheme of the FRET-based annealing and strand displacement assay. In phase I, the kinetics of annealing are tested by mixing 10 nM of two complementary RNA strands which are 5′-labeled with a Cy5 or a Cy3 dye, respectively, and monitoring their fluorescent signals. Duplex formation allows for FRET which is therefore a measure of the fraction of annealed double-strands. Phase II is started by the injection of a 10-fold excess of competitor RNA which resembles one of the strands from phase I, but is unlabeled. In the presence of a protein with helix destabilizing activity, the pre-formed duplex is opened up so that the competitor strand can invade and as a result, the FRET signal decreases. (B) 1 µM Tat(44-61), 100 nM Hfq and 1 µM StpA (serving as a positive control), were tested in this assay using the JM1 RNA substrate. For better visual comparability, the calculated FRET index was normalized between 0 and 1 (phase I) or to 1 only (phase II). While all three proteins accelerated annealing of JM1, only StpA and Hfq showed strand displacement activity with this substrate. Interestingly, Hfq did not catalyse strand displacement of the substrate JM3 which has a higher GC-content than JM1. The JM3 ‘RNA only’ curve is very similar to the JM1 curve and is thus not shown.

