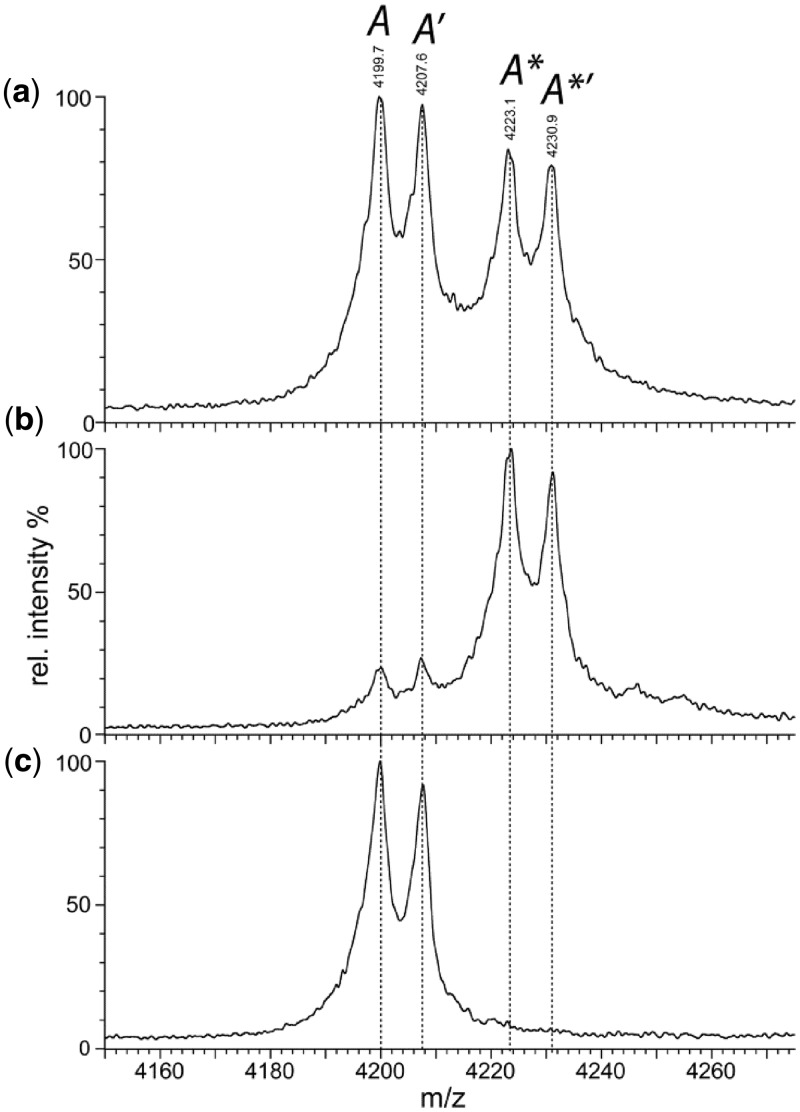
Figure 2.
Native MS. Nano-ESI mass spectroscopy of the E53A mutant of BcgI (19 µM) in 200 mM AmAc under non-denaturing conditions (see ‘Materials and Methods’ section) gave the complete spectrum shown in Figure 1 of the preceding paper (11). Shown here, on an expanded m/z scale, are the profiles of a single charge state (+17) of the A protein that had dissociated from the A2B assembly in solution. (a) The native spectrum under the conditions used previously (11) to minimize disruption of non-covalent complexes; four peaks are marked in italics as A, A′, A* and A*′ (see text and Table 1). (b) The same spectrum but after the addition of SAM to a final concentration of 56 µM. (c) The same sample as in (b) but recorded under conditions that lead to complete disruption of non-covalent complexes; the trap collision energy was increased to 90 V to effect gas-phase dissociation of bound ligands but not the fragmentation of the polypeptide chains.

