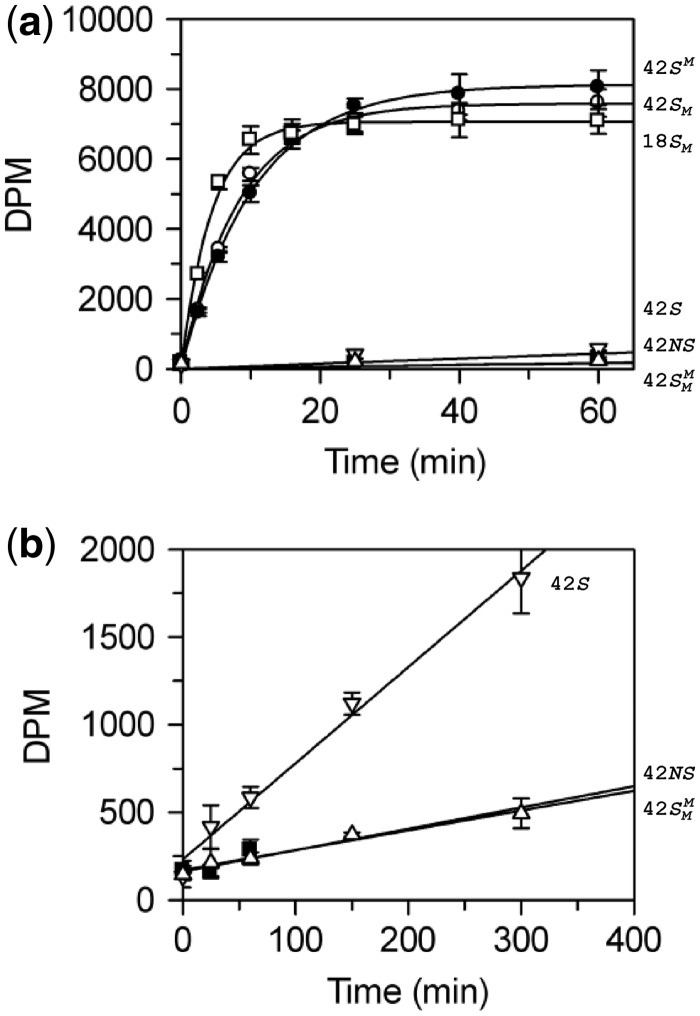
Figure 3.
BcgI methylation of
oligoduplexes. (a) Reactions, at 37°C in buffer M (which includes
3H-SAM), contained 60 nM BcgI protein and one of the following
oligoduplexes at 300 nM, as indicated on the right:  (18 bp specific duplex, bottom strand methylated), white
squares;
  (42 bp, bottom strand methylated),
white circles;
  (top strand methylated), black circles;
 (both strands methylated), white
triangles; 42S (neither strand methylated), white inverted
triangles; 42NS (42 bp non-specific duplex, no recognition site),
black squares. Samples were withdrawn from the reaction at the times indicated,
quenched and the amount of radiolabel in the DNA at each time point was then
measured as in the ‘Materials and Methods’ section. (b)
Data from the reactions on 42S, 42NS and
 are plotted on an extended time scale
(400 instead of 60 min) and a reduced dpm scale (2000 instead of 10 000 dpm). Each
data point is the mean of three repeats; error bars denote standard deviations. The
lines drawn through the data in (a) from
  ,
,  and
and  correspond to the best fits to exponential functions. The
lines drawn through the data from 42 S, 42NS and
 , in both (a) and (b), are fits to
linear slopes.

