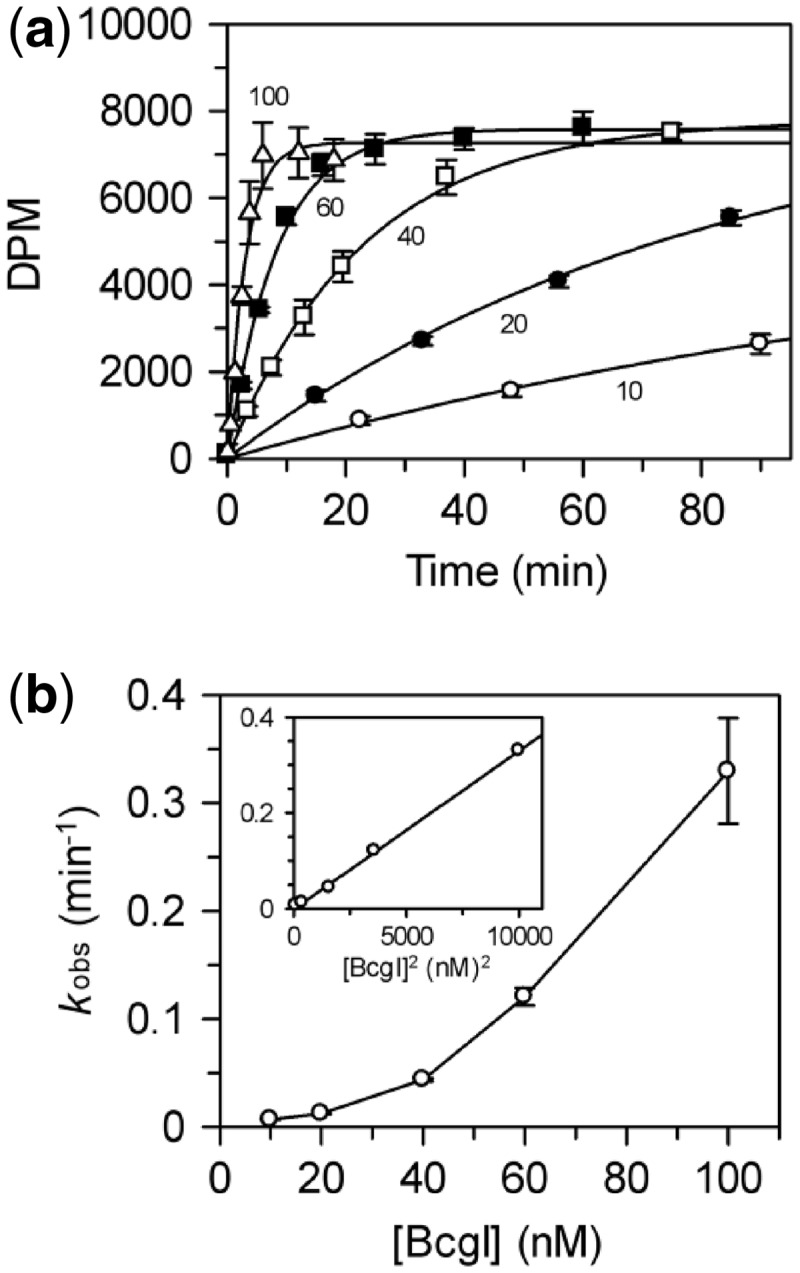
Figure 4.

Dependence of methylation rate on BcgI
concentration. (a) Reactions, at 37°C in buffer M, contained the HM
oligoduplex  (300 nM) and BcgI RM protein at one of the following
concentrations: 10 nM, white circles; 20 nM, black circles; 40 nM, white squares; 60
nM (data from Figure 3), black squares;
100 nM, white triangles. Samples were withdrawn from the reaction at the times
indicated and stopped immediately, prior to measuring the incorporation of the
radiolabel into the DNA as in the ‘Materials and Methods’ section. Each
data point is the mean of three repeats (error bars mark standard deviations) and
the line drawn through the sets of mean values at each concentration (noted in nM
next to each line) is the best fit of that data to an exponential function.
(b) The first-order rate constants from the fits in (a) are plotted
against the enzyme concentration; the inset shows the same data re-plotted against
the square of the enzyme concentration. Error bars mark standard errors on the rate
constants.
