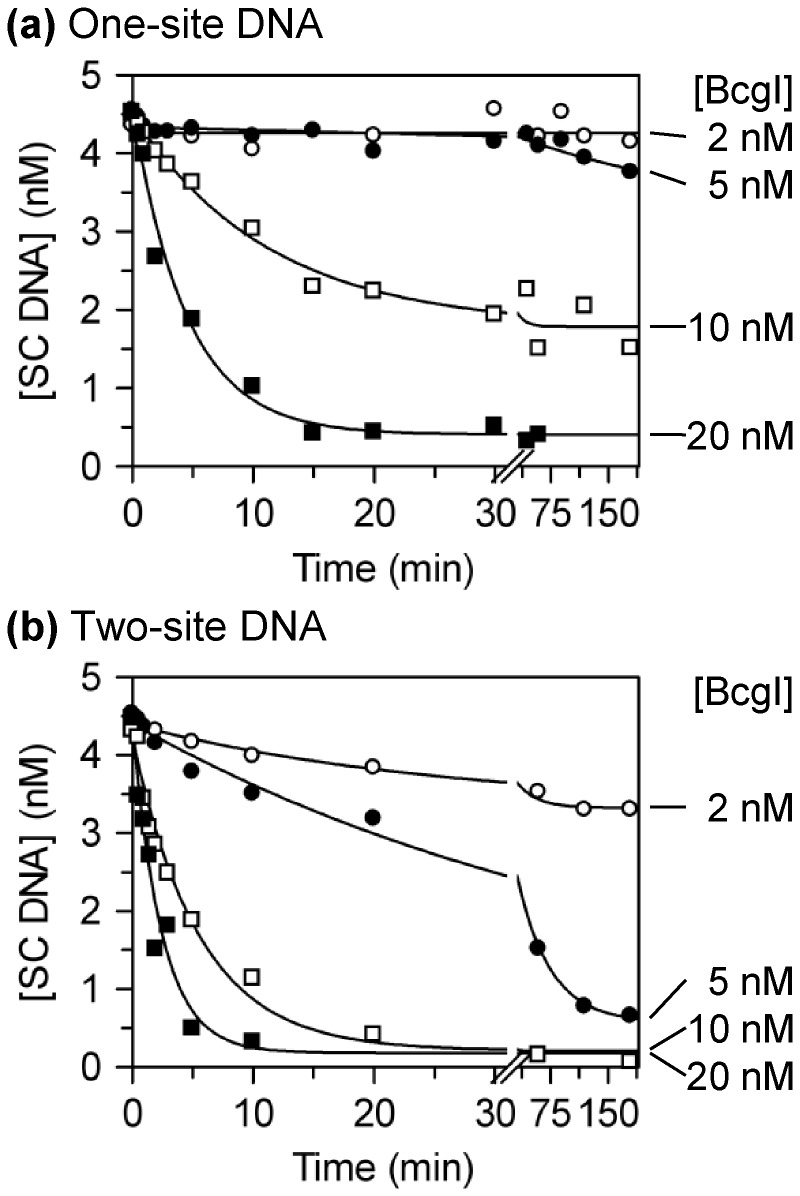
Figure 5.
DNA cleavage at low [BcgI]. Reactions in buffer R at 37°C contained one of the following plasmids (3H-labelled, initially ∼90% SC monomer) at 5 nM and BcgI protein at the concentrations noted below. The plasmids were (a) pUC19, which has one BcgI site; (b) pDG5, which has two sites. The enzyme concentrations for each reaction are marked on the right: 2 nM, white circles; 5 nM, black circles; 10 nM, white squares; 20 nM, black squares. Samples were taken at the indicated times and analysed by electrophoresis to separate the SC substrate from the cleaved products. The residual concentrations of the SC DNA were determined and are plotted as a function of time. The lines are the best fits to single exponential decays with floating offsets.

