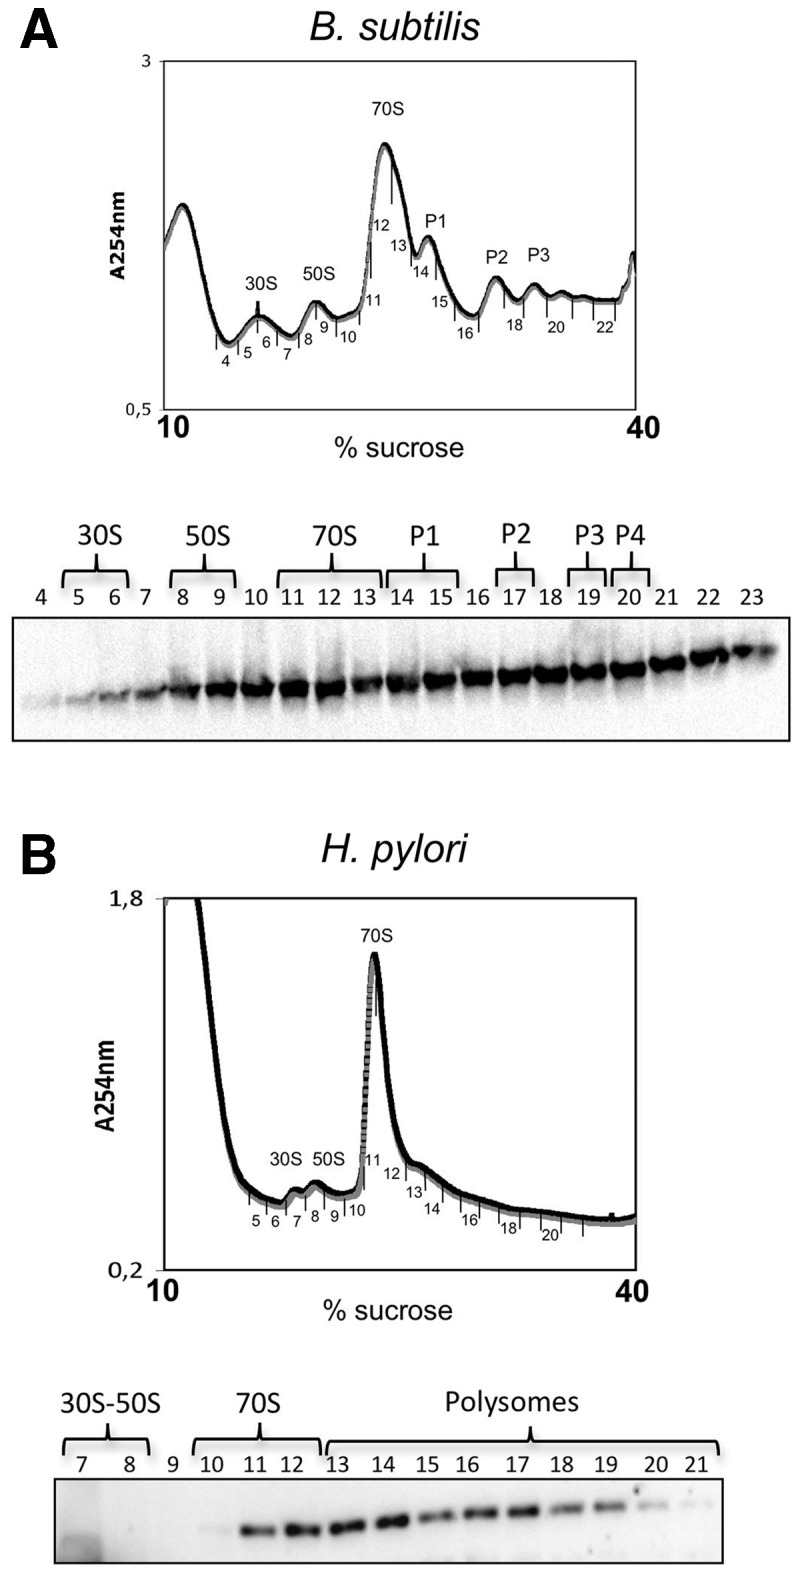
Figure 7.

Comparison of RNase J distribution between ribosomal fractions in B. subtilis and H. pylori. (A) Upper panel: polysome profile of B. subtilis cell extracts on a 10–40% sucrose gradient. Peaks corresponding to ribosome fractions are indicated. Lower panel: western blot with Bsu-RNase J1-specific antibodies revealing the presence of Bsu-RNase J1 in the collected fractions. (B) Polysome profile of H. pylori cell extract on 10–40% sucrose gradient and distribution of Hp-RNase J in the collected fractions.
